System Activity
Introduction
System Activity is akin to the Microsoft Windows' Task Manager, Apple's Mac OS X's Activity Monitor and Gnome's System Monitor. It pops up when you press the keyboard shortcut Ctrl + Esc or from the System Activity icon,![]() , in a KRunner (Alt + F2) window.
, in a KRunner (Alt + F2) window.
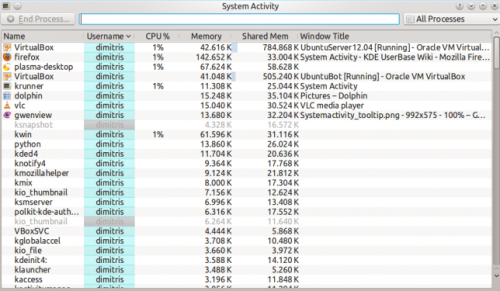
It shows a list of currently running processes, along with their CPU usage, Memory usage, and various other pieces of information.
General Tips
Almost every part of the UI displays a tooltip, when you hover the mouse over it for long enough, to provide more detailed information, and "WhatsThis" functionality, activated by clicking the ![]() button, to explain what the information means.
button, to explain what the information means.
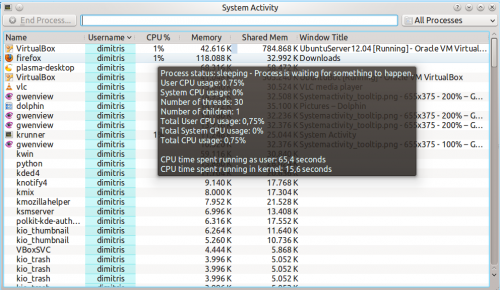
For example, hovering over the CPU usage for a process we can see various other bits of information including how much time the program has been running for in total.
Why is my system currently running slowly?
A system can be running unusually slow because a process (program) is demanding all of the computer's processing power (CPU usage) or is using all of the computer's memory.
By default, processes owned by the current user that are using a lot of CPU or memory are near the top. This means that any misbehaving programs should be near the top and easily visible. For example:
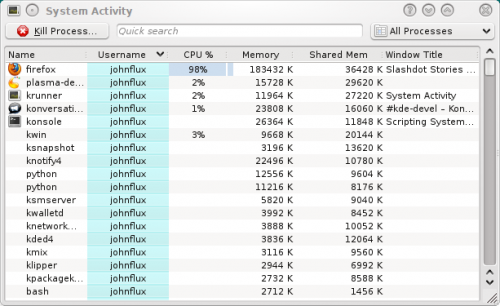
In this example, Firefox has stopped responding and is using 99% of CPU.
To end the process that is misbehaving, click on the process to select it and press the button. This will send a polite request to the program, asking it to close.
I can't kill it - it just won't die!
Thankfully it's fairly rare, but just occasionally you may meet this. If the process is misbehaving it may ignore your request to end, so we may need to force the program to end immediately. Doing this may result in losing any documents etc that the program had opened but not saved. To do this, right click on the process and choose then choose .
Sometimes even this will not kill the process, or the option will not be given. This can happen, for example, in vuze with certain kernels. If the process or one of its threads gets caught in a kernel bug then it can end up being stuck trying to execute a kernel operation and being completely unkillable. Often there is no solution to this other than rebooting the machine.
Zombie processes
Processes which are in a Zombie state are already dead, and so cannot be killed. The system keeps them around until their parent process notices, which is usually a very short amount of time. Seeing a Zombie process usually indicates that the parent process has stopped responding.
Targeting a window to kill
If you want to kill a particular window that has frozen up, simply press Ctrl + Alt + Esc at any time. The mouse cursor should turn into an image of a skull and cross bones. Now click the window that you want to kill. Note that this will kill the application immediately, and you may lose any unsaved data.
The Memory column shows approximately the amount of memory (RAM) that the process is using by itself, privately. The Shared Memory column is approximately the memory that is, or could be, shared with other programs. For example, the KDE libraries are used by all KDE programs and so are loaded into memory only once.
Technical Information
The "Memory" column shows the value of VmRSS - Shared, and so is generally lower than the values shown by top etc. This does not include memory backed I/O pages, and does not include memory used by the x server to store any pixmaps used by the application. This value is often called the Unique RSS size, or URSS. This approximates the value shown as Private memory usage in the .
The Shared memory is the same as the SHR column in top and can be somewhat inaccurate. This approximates the value shown as Shared memory usage in the .
Specifically the process list parses /proc/pid/stat whereas the dialog parses /proc/pid/smaps.
How do I view more Detailed Memory Information about a process?
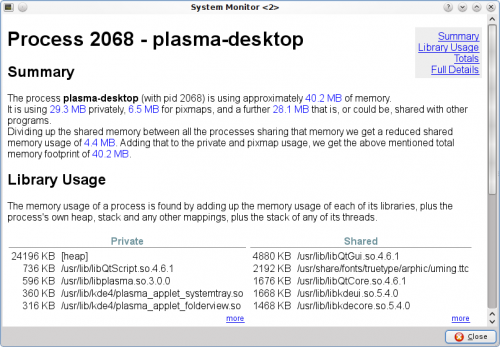
From KDE SC 4.4 you will be able to select a process in the table, right click on the process, and choose , and get something like:
Why do values in Detailed Memory Information not match the process list?
The process list in System Activity is using an approximation to gather the values. The gives more accurate values.
Why is the "Xorg" process using so much memory?
This is the process that displays all the other applications. Its memory usage includes all the memory used on the video card to store all the pixmaps (images) from applications.
In general you do not need to worry about the memory usage of Xorg.
How do I see the PID of a process?
If you want to see the PID of a single process, hover the mouse cursor over the name of the process. The PID will be shown in the tooltip.
If you want to see the PID of all the processes, right click on any column heading and you will see the menu:
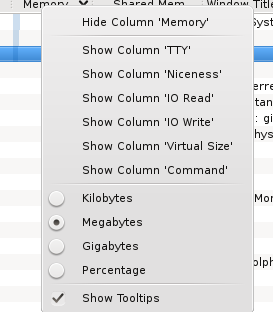
Choose .
Can System Activity show the I/O Hard Disk usage, like iotop?
Right click on the column headings, and choose and again for . It will now show the amount of data being sent to or from the hard disk.
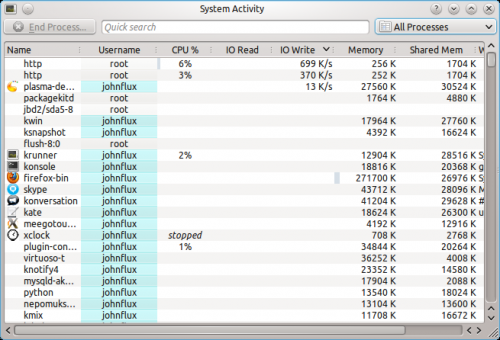
By right clicking on the column header you can choose whether you want to view the actual amount of data being written or read from the hard disk (the default), or whether you are interested in seeing how much data the application is sending or requesting from a file.
Data requested and actual data read from the hard disk are not equivalent - for example, if two applications read from the same file the operating system does not need to read from the actual hard disk twice - it can just read it once and remember it for a short while. Similarly, if one process writes to a file, but then another process writes over the top of that same file, there's no point writing the first version of the file to the actual hard disk.
Why are some processes grayed out?
For example the process xclock:

This means that the process has already died. It is shown as a disabled
process just for convenience to make it easier to see processes that are quit.
The values for the CPU usage, Memory usage, etc are just the values from when the process was last seen alive. A process that has ended does not take up any resources (it uses no CPU, memory etc).
What are all of these processes owned by root and taking up no memory?
These are kernel threads. They exist only inside the kernel, and exist to allow the kernel to perform multiple tasks in parallel.
They are shown because occasionally they can be a cause of heavy CPU usage. For example, under a heavy load, and with bad drivers, a network card can produce a huge number of interrupts, resulting in a high CPU usage in the ksoftirqd kernel thread.
Likewise, a high CPU usage in kjournald can indicate that DMA transfer is not enabled on the hard disk.
Why do I have so many processes?
A normal average-user system has around 150 to 200 processes with strange sounding names. It would be nice to setup a wiki page giving a short description of each of these processes, but so far nobody has done this. ![]()
Why is OpenOffice.org not showing up as a graphical program?
Before version 3.3, OpenOffice.org did not correctly implement the window standards. Specifically, their windows did not set _NET_WM_PID to link the windows to the process. This is now fixed in OpenOffice.org 3.3.
Why is gvim showing up strangely as a graphical program?
This is a fault with the GVim program. GVim does not correctly implement the window standards. Specifically, when it starts up it forks a new process to avoid hanging the shell that it ran from. But it sets the _NET_WIN_PID property to the previous PID. The authors have been notified but have not fixed this yet.
