Kalzium/Screenshots: Difference between revisions
< Kalzium
Pipesmoker (talk | contribs) No edit summary |
Pipesmoker (talk | contribs) (→Tools: added descriptions) |
||
| (One intermediate revision by the same user not shown) | |||
| Line 8: | Line 8: | ||
{| cellpadding="10" | {| cellpadding="10" | ||
| [[Image:Kalzium_atom_model.png|350px]] | | [[Image:Kalzium_atom_model.png|350px]] | ||
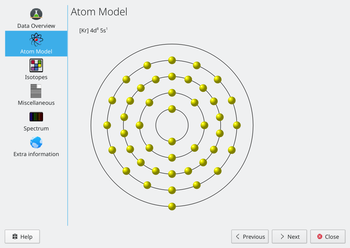
| | | The ''Atom Model'' tab displays the atomic shells. Every orbit stands for a atomic shell and every yellow circle represents an electron. | ||
|- | |- | ||
| [[Image:Kalzium_isotopes.png|350px]] | | [[Image:Kalzium_isotopes.png|350px]] | ||
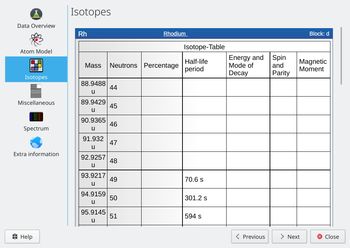
| | | The ''Isotopes'' tab presents information about the isotopes of an element: mass, number of neutrons, percentage of atoms occurring, half-life period and more. | ||
|- | |- | ||
| [[Image:Kalzium_data_overview.png|350px]] | | [[Image:Kalzium_data_overview.png|350px]] | ||
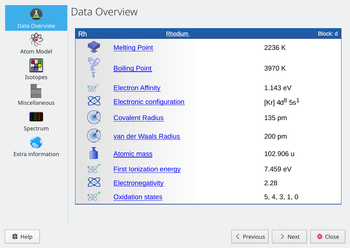
| | | The ''Data Overview'' tab tells you about different facts related to the element. | ||
|} | |} | ||
| Line 22: | Line 22: | ||
{| cellpadding="10" | {| cellpadding="10" | ||
| [[Image:Kalzium_state_of_matter.png|350px]] | |||
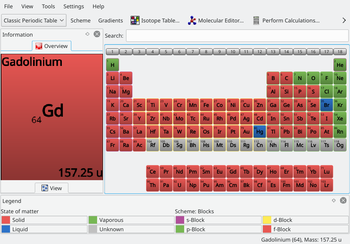
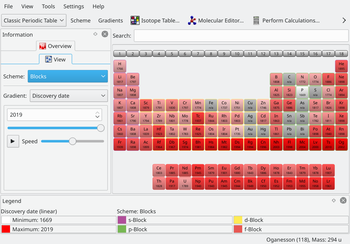
| '''Kalzium''' can show you which elements are solid/liquid/vaporous at a given temperature. The colorscheme is explained in the ''Legend'' at the bottom of the window. | |||
|- | |||
| [[Image:Kalzium_timeline.png|350px]] | | [[Image:Kalzium_timeline.png|350px]] | ||
| | | The ''Timeline'' feature allows you to explore the elements of the set time period. This is great for getting a feel for how the PSE evolved over time. See what elements are allready discovered 1800. | ||
|- | |- | ||
| [[Image:Kalzium_isotope_table.png|350px]] | | [[Image:Kalzium_isotope_table.png|350px]] | ||
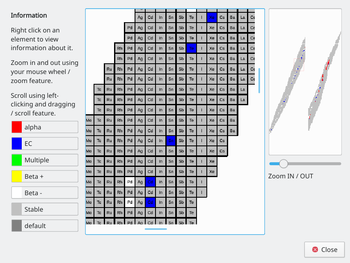
| | | The ''Isotope Table'' shows you the isotopes of the elements. Different colors represent different decay types. Move around and zoom in and out. | ||
|- | |- | ||
| [[Image:Kalzium_molecular_editor.png|350px]] | | [[Image:Kalzium_molecular_editor.png|350px]] | ||
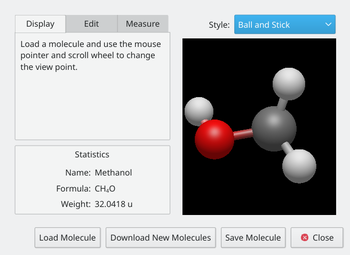
| | | '''Kalzium''' offers a 3D ''Molecular Editor''. You can compose molecules yourself or open an included example. You can rotate the view around every atom in the molecule. | ||
|} | |} | ||
Latest revision as of 11:26, 5 July 2010
Home » Applications » Education » Kalzium » Screenshots

Under Construction
This is a new page, currently under construction!
Information Dialog
Whe you click on an element in the periodic table you will get an extensive information window divided into several tabs. Here are some examples for the element Rhodium:
Tools
Kalzium offers some more tools to explore chemical data:
Glossary
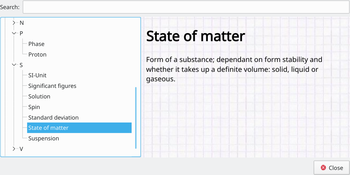
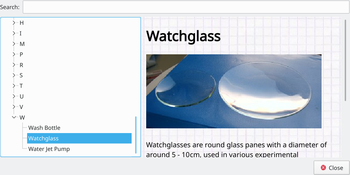
Many more information all around chemistry, lab tools and so on are presented in the glossary.
|
|
|

