LabPlot/fr: Difference between revisions
Appearance
Updating to match new version of source page |
ChristianW (talk | contribs) No edit summary |
||
| (10 intermediate revisions by 2 users not shown) | |||
| Line 8: | Line 8: | ||
== Introduction == | == Introduction == | ||
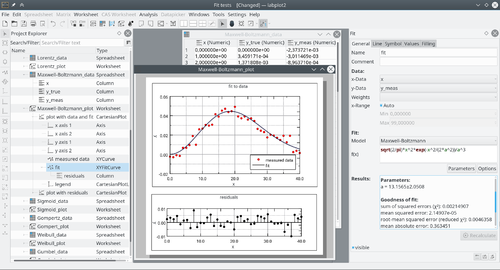
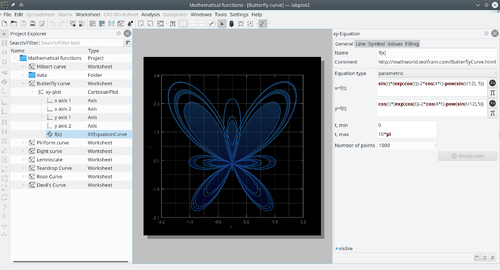
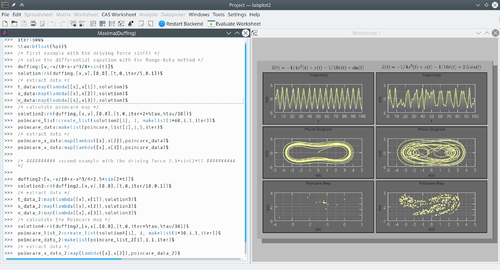
'''LabPlot''' | '''LabPlot''' prend en charge le dessin 2D par points, l'analyse de données (par exemple: la transformation de Fourier, les modèles de régression linéaire et non linéaires), les systèmes de calcul symbolique (CAS - Computer Algebra Systems) tels que [https://en.wikipedia.org/wiki/Maxima_(software) Maxima] et [https://en.wikipedia.org/wiki/GNU_Octave GNU Octave] ainsi que l'import et l'export en différents formats. | ||
Une liste complete des fonctionnalités LabPlot est disponible sur les [https://labplot.kde.org/features/ pages web LabPlot]. | |||
== | == Captures d'écran == | ||
[[File:Labplot2 appdata 01.png|500px|thumb|center]] | |||
[[ | [[File:Labplot2 appdata 02.png|500px|thumb|center]] | ||
[[File:Labplot2 appdata 03.png|500px|thumb|center]] | |||
D'autres exemples d'écrans sont disponibles sur les [https://labplot.kde.org/gallery/ pages web de LabPlot]. | |||
== Documentation == | == Documentation == | ||
* [[Special:myLanguage/LabPlot/GettingStarted| | * [[Special:myLanguage/LabPlot/GettingStarted|Pour commencer]] | ||
* [[Special:myLanguage/LabPlot/UserGuide| | * [[Special:myLanguage/LabPlot/UserGuide|Guide utilisateur]] | ||
* [[Special:myLanguage/LabPlot/Tutorials| | * [[Special:myLanguage/LabPlot/Tutorials|Tutoriels et HOWTOs]] | ||
* [[Special:myLanguage/LabPlot/FAQ|FAQ]] | * [[Special:myLanguage/LabPlot/FAQ|FAQ]] | ||
== | == Autres informations == | ||
* [https://labplot.kde.org | * [https://labplot.kde.org Page d'accueil ''labplot''] | ||
* [https://twitter.com/LabPlot Twitter] | * [https://twitter.com/LabPlot Twitter] | ||
* [https://www.youtube.com/channel/UCoxs-QOKb4SdIk4TMbrTzlQ YouTube] | * [https://www.youtube.com/channel/UCoxs-QOKb4SdIk4TMbrTzlQ YouTube] | ||
* Wikipedia (en) | * Wikipedia (en) | ||
** [https://en.wikipedia.org/wiki/LabPlot | ** [https://en.wikipedia.org/wiki/LabPlot Article principal] | ||
** [https://en.wikipedia.org/wiki/List_of_information_graphics_software | ** [https://en.wikipedia.org/wiki/List_of_information_graphics_software Liste de logiciels graphiques d'information] | ||
** [https://en.wikipedia.org/wiki/LabPlot | ** [https://en.wikipedia.org/wiki/Comparison_of_numerical-analysis_software Comparaison de logiciels d'analyse numérique] | ||
* Pour citer LabPlot dans les publications utiliser (voir aussi [https://guides.libraries.uc.edu/citing/code "Référencer le code d'un programme dans un rapport ou un journal"]): | |||
<source> | |||
LabPlot Team (2022), LabPlot: A FREE, open source, cross-platform Data Visualization and Analysis software accessible to everyone, | |||
(Version 2.9) [Computer software]. https://labplot.kde.org. | |||
</source> | |||
[[Category:Science]] | [[Category:Science]] | ||
Latest revision as of 19:05, 26 January 2023
Introduction
LabPlot prend en charge le dessin 2D par points, l'analyse de données (par exemple: la transformation de Fourier, les modèles de régression linéaire et non linéaires), les systèmes de calcul symbolique (CAS - Computer Algebra Systems) tels que Maxima et GNU Octave ainsi que l'import et l'export en différents formats.
Une liste complete des fonctionnalités LabPlot est disponible sur les pages web LabPlot.
Captures d'écran


D'autres exemples d'écrans sont disponibles sur les pages web de LabPlot.
Documentation
Autres informations
- Page d'accueil labplot
- YouTube
- Wikipedia (en)
- Pour citer LabPlot dans les publications utiliser (voir aussi "Référencer le code d'un programme dans un rapport ou un journal"):
      LabPlot Team (2022), LabPlot: A FREE, open source, cross-platform Data Visualization and Analysis software accessible to everyone,
      (Version  2.9) [Computer software]. https://labplot.kde.org.
