Draft:Draft/RKWard: Difference between revisions
Splitting list into smaller units |
Yet another screenshot |
||
| (2 intermediate revisions by the same user not shown) | |||
| Line 38: | Line 38: | ||
== Programming in RKward == | == Programming in RKward == | ||
[[File:Rkward programming.png|500px|thumb|center|The code editor]] | |||
== Taking a look at R objects == | == Taking a look at R objects == | ||
| Line 52: | Line 52: | ||
Along with code aids, RKward has a way to handle data directly from the program. In particular, one can view matrices and ''data frames'' (R's own definition of data tables) in the interface, or create new ones. | Along with code aids, RKward has a way to handle data directly from the program. In particular, one can view matrices and ''data frames'' (R's own definition of data tables) in the interface, or create new ones. | ||
Existing data can be imported: RKWard supports text files (TSV/CSV) and also data from widely used statistics programs such as STATA or SPSS. | |||
[[File:Rkward import.png|450px|thumb|center|The TSV import dialog]] | |||
The interface can show the column names, the types of te columns (numbers, strings, etc.) and the data itself, using a spreadsheet-like user interface. | The interface can show the column names, the types of te columns (numbers, strings, etc.) and the data itself, using a spreadsheet-like user interface. | ||
| Line 64: | Line 66: | ||
RKWard offers simplified front-ends to a number of R's statistical functions and to generate graphs for data. These can be accessed from the ''Analysis'', ''Plots'' and ''Distributions'' menus. | RKWard offers simplified front-ends to a number of R's statistical functions and to generate graphs for data. These can be accessed from the ''Analysis'', ''Plots'' and ''Distributions'' menus. | ||
TBD examples | [[File:Rkward analysis.png|450px|thumb|center|One of the many analysis aids]] | ||
TBD examples | |||
Latest revision as of 07:29, 27 June 2011
Overview
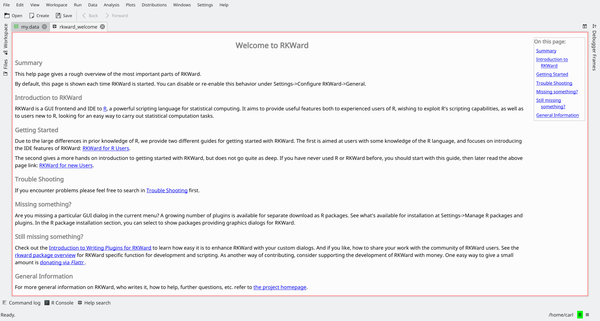
RKWard is an integrated development environment (IDE) built on top of the KDE Development Platform for the R programming language, a language heavily oriented for statistics and data manipulation,
Features
- Development environment with syntax highlighting, code completion, object browser, and data editor
- Transparent interface to R
- Graphical tools to access R's statistical and graphing functions
- Integrated R prompt for read-eval-print-loop (REPL) work
- R package management
- Loading/Saving R's workspace states
- Extensible through ECMAscript plugins
Modes of operation
RKWard can be used in two different ways: either like a normal IDE; that is to write code which then will be incorporated in programs or scripts, via an interactive session where the code is immediately evalued (this is the preferred way of working of R programmers) and a mixture of both.
Interactive interpreter
RKward offers an integrated R prompt which can be used in a so-called "read-eval-print-loop" (REPL) way.

The prompt is by all intents and purposes identical to the R console prompt, with some additional capabilities. For example, along with function name completion, it supports calltips (pop-up boxes which show a function's signature) and also various way of copying and pasting the code.
This way operates like a normal R session: commands are inputted, output and other objects are created, and results can be shown or saved to disk using R's own functions.
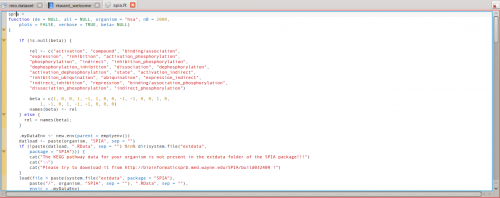
Programming in RKward
Taking a look at R objects
Since working in R often involves loading "libraries" (add-on packages) and creating multiple objects, RKward offers an interface to inspect and show the objects loaded in memory by R.
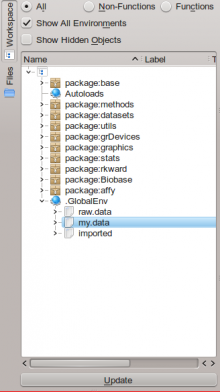
The object browser allows access to both R's global environment and the packages's own environment. Additional information are available either as tooltips or by double-clicking items, which will open a new tab in RKWard's interface showing information on the object in question.
Data manipulation
Along with code aids, RKward has a way to handle data directly from the program. In particular, one can view matrices and data frames (R's own definition of data tables) in the interface, or create new ones.
Existing data can be imported: RKWard supports text files (TSV/CSV) and also data from widely used statistics programs such as STATA or SPSS.
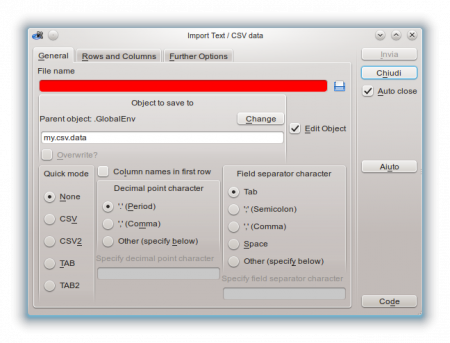
The interface can show the column names, the types of te columns (numbers, strings, etc.) and the data itself, using a spreadsheet-like user interface.
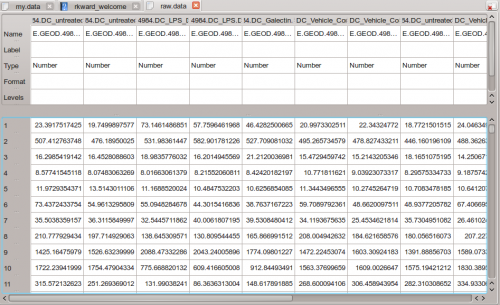
There is direct support for editing and data manipulaiton. TBD make it more in depth.
Interactive statistics and plotting
RKWard offers simplified front-ends to a number of R's statistical functions and to generate graphs for data. These can be accessed from the Analysis, Plots and Distributions menus.
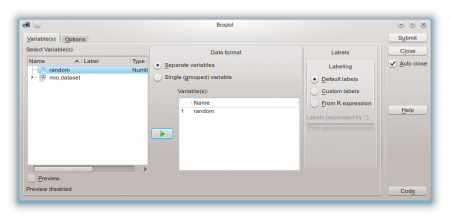
TBD examples
