LabPlot/Interface/ProjectExplorer: Difference between revisions
Created page with "Project Explorer is the component in LabPlot visualising the stucture of the project. This structure is a parent-child hierarchy with the nodes in this hierarchy being the dif..." |
m Fix minor typos |
||
| (22 intermediate revisions by one other user not shown) | |||
| Line 1: | Line 1: | ||
Project Explorer is the component in LabPlot | ==Basic Concepts== | ||
[[File:LabPlot MainWindow project explorer.png |500px|thumb|center]] | |||
Project Explorer is the component in LabPlot visualizing the structure of the project. This structure is a parent-child hierarchy with the nodes in this hierarchy being the different project entities. The root node in this hierarchy stands for the project itself. | |||
New objects are added to the project via the "Add New" menu in the main menu bar, via the corresponding actions in the toolbar, or via the context menu in the project explorer. After a new object was added, a new node for it appears in the project explorer. Upon the selection of an object in the project explorer, its view or the view of the next parent having a view is shown in the main area. | |||
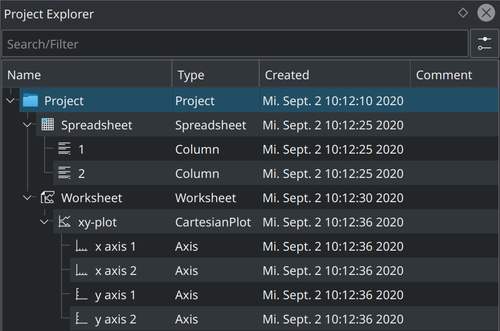
On default, there are four columns in the project explorer showing the name of the object, its type (Spreadsheet, Worksheet, etc.), the creation date, and additional comment that can be provided for every object: | |||
[[File:LabPlot project explorer default columns.png |500px|thumb|center]] | |||
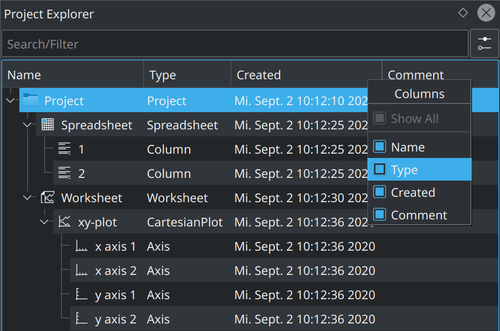
The default behavior can be changed and the user can define which columns to show. Via the context menu of the header in the tree view the selection of which columns to show can be done. | |||
[[File:LabPlot project explorer columns context menu.png |500px|thumb|center]] | |||
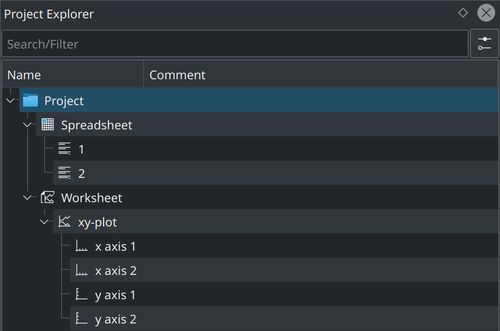
The example below shows the same project structure as in the previous example but only with object names and comments shown: | |||
[[File:LabPlot project explorer name and comment columns.png |500px|thumb|center]] | |||
==Folders== | |||
The parent-child hierarchy mentioned above can be further structured with the help of folders. Similar to the concept of folders known from file systems, a folder in LabPlot serves as a parent container where other objects can be placed under. | |||
In the beginning, there is only one folder available in the project - the root folder representing the project itself. New folders are created similarly to other new objects via the context menu of the project explorer, etc. The screenshot below shows an example of how a project can be structured using folders: | |||
[[File:LabPlot project explorer folders.png |500px|thumb|center]] | |||
==Search and Filter== | |||
The project explorer provides basic search capabilities. By starting typing in the search/filter text field the content shown in the project explorer is limited to those objects only where the names are matching the current search string. Furthermore, with the option ''Case Sensitive'' and ''Match Whole Word'' the user can control the search behavior. | |||
[[File:LabPlot project explorer filtered.png |500px|thumb|center]] | |||
==Drag&Drop== | |||
Drag&drop within the project explorer is possible. Because of the specific semantic meaning behind the different project objects, the source and the destination for such a drag&drop process cannot be arbitrary. The supported workflows are: | |||
* Move/reparent a top-level object (Folder, Spreadsheet, Worksheet, etc.) - drag a top-level object and drop it on another folder | |||
* Move Spreadsheet or Matrix into Workbook - drag a spreadsheet or a matrix and drop it onto a workbook | |||
* Quick plotting of the data - drag a spreadsheet column and drop it on an already existing plot | |||
{{#ev:youtube|Yw5Hivcp2y8|500|center}} | |||
Latest revision as of 13:34, 3 April 2021
Basic Concepts
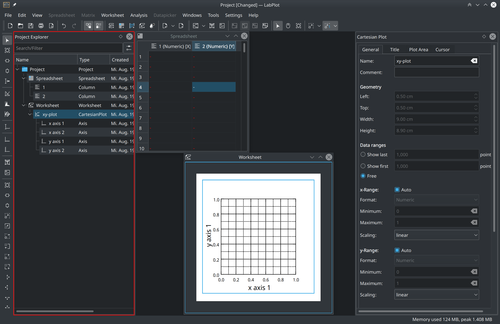
Project Explorer is the component in LabPlot visualizing the structure of the project. This structure is a parent-child hierarchy with the nodes in this hierarchy being the different project entities. The root node in this hierarchy stands for the project itself.
New objects are added to the project via the "Add New" menu in the main menu bar, via the corresponding actions in the toolbar, or via the context menu in the project explorer. After a new object was added, a new node for it appears in the project explorer. Upon the selection of an object in the project explorer, its view or the view of the next parent having a view is shown in the main area.
On default, there are four columns in the project explorer showing the name of the object, its type (Spreadsheet, Worksheet, etc.), the creation date, and additional comment that can be provided for every object:
The default behavior can be changed and the user can define which columns to show. Via the context menu of the header in the tree view the selection of which columns to show can be done.
The example below shows the same project structure as in the previous example but only with object names and comments shown:
Folders
The parent-child hierarchy mentioned above can be further structured with the help of folders. Similar to the concept of folders known from file systems, a folder in LabPlot serves as a parent container where other objects can be placed under.
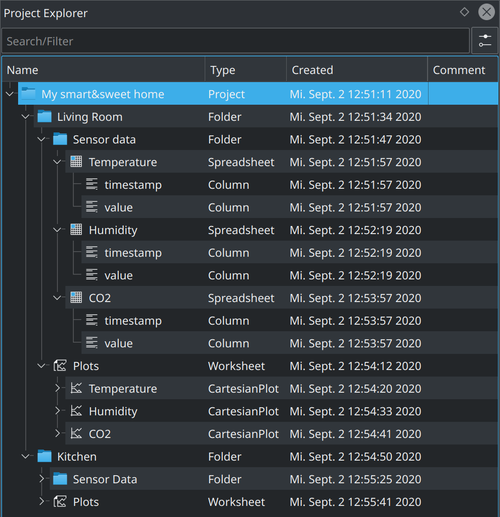
In the beginning, there is only one folder available in the project - the root folder representing the project itself. New folders are created similarly to other new objects via the context menu of the project explorer, etc. The screenshot below shows an example of how a project can be structured using folders:
Search and Filter
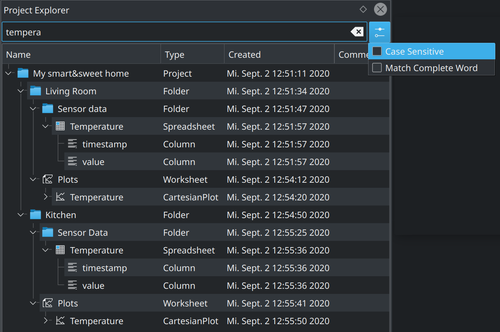
The project explorer provides basic search capabilities. By starting typing in the search/filter text field the content shown in the project explorer is limited to those objects only where the names are matching the current search string. Furthermore, with the option Case Sensitive and Match Whole Word the user can control the search behavior.
Drag&Drop
Drag&drop within the project explorer is possible. Because of the specific semantic meaning behind the different project objects, the source and the destination for such a drag&drop process cannot be arbitrary. The supported workflows are:
- Move/reparent a top-level object (Folder, Spreadsheet, Worksheet, etc.) - drag a top-level object and drop it on another folder
- Move Spreadsheet or Matrix into Workbook - drag a spreadsheet or a matrix and drop it onto a workbook
- Quick plotting of the data - drag a spreadsheet column and drop it on an already existing plot
{{#ev:youtube|Yw5Hivcp2y8|500|center}}
