KSysGuard/zh-tw: Difference between revisions
m (Created page with "==系統負載==") |
m (Created page with "<menuchoice>系統負載</menuchoice>屏有3個顯示圖表,每個分別描繪如下負載要素- 「CPU歷史」,「記憶體和Swap歷史」,「網絡歷史」。如果...") |
||
| Line 10: | Line 10: | ||
==系統負載== | ==系統負載== | ||
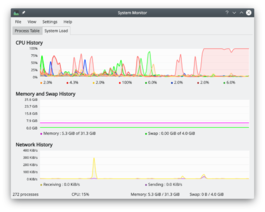
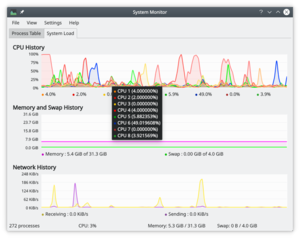
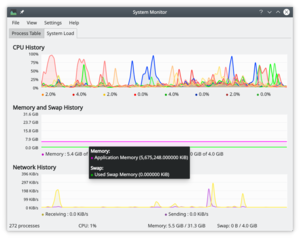
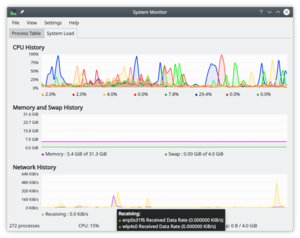
<menuchoice>系統負載</menuchoice>屏有3個顯示圖表,每個分別描繪如下負載要素- 「CPU歷史」,「記憶體和Swap歷史」,「網絡歷史」。如果你懸停鼠標指針到每個部分的,你會看到帶有顏色的詳細分析。 | |||
{|class="tablecenter" | {|class="tablecenter" | ||
Revision as of 14:40, 17 November 2010
 |
追蹤和控制系統中的行程。 |
概述
KSysGuard 設計成無需使用者特別設定即可進行簡單的行程控制 - 預設的通常完全夠用。有兩張工作表 - 頁(上面是圖表)和。
系統負載
屏有3個顯示圖表,每個分別描繪如下負載要素- 「CPU歷史」,「記憶體和Swap歷史」,「網絡歷史」。如果你懸停鼠標指針到每個部分的,你會看到帶有顏色的詳細分析。
 |
 |
 |
The Process Table
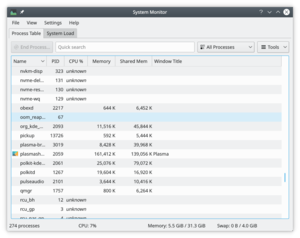
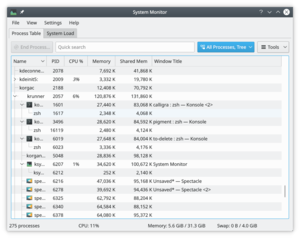
The view by default gives you an alphabetical order list of all processes running. Clicking on any column header will make this the sort column. If you have a runaway process you will find the view most useful. You can also elect to see sub-sets of the processes, by owner or program.
 |
 |
Hints and Tips
Ctrl + Esc brings up the Processes part of KSysGuard, which is very helpful when you are trying to find which application is using too many resources.
In KRunner (Alt + F2 or from a right-click on the desktop) there is a tiny icon to the left of the entry bar - it looks like a microwave oven - that also brings up the Process Table.
