KSysGuard/zh-tw: Difference between revisions
m (Created page with "<menuchoice>系統負載</menuchoice>屏有3個顯示圖表,每個分別描繪如下負載要素- 「CPU歷史」,「記憶體和Swap歷史」,「網絡歷史」。如果...") |
m (Created page with "==進程表==") |
||
| Line 20: | Line 20: | ||
|} | |} | ||
== | ==進程表== | ||
The <menuchoice>All Processes</menuchoice> view by default gives you an alphabetical order list of all processes running. Clicking on any column header will make this the sort column. If you have a runaway process you will find the <menuchoice>All Processes, Tree</menuchoice> view most useful. You can also elect to see sub-sets of the processes, by owner or program. | The <menuchoice>All Processes</menuchoice> view by default gives you an alphabetical order list of all processes running. Clicking on any column header will make this the sort column. If you have a runaway process you will find the <menuchoice>All Processes, Tree</menuchoice> view most useful. You can also elect to see sub-sets of the processes, by owner or program. | ||
Revision as of 14:40, 17 November 2010
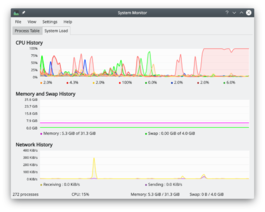 |
追蹤和控制系統中的行程。 |
概述
KSysGuard 設計成無需使用者特別設定即可進行簡單的行程控制 - 預設的通常完全夠用。有兩張工作表 - 頁(上面是圖表)和。
系統負載
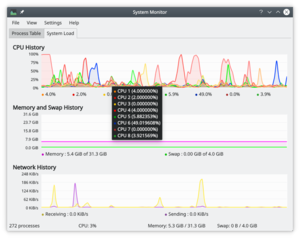
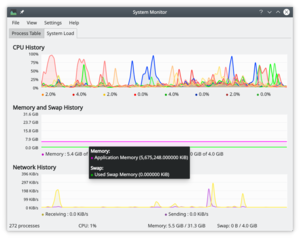
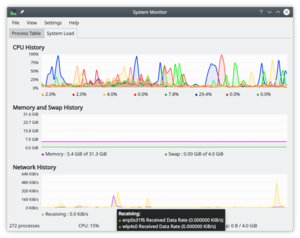
屏有3個顯示圖表,每個分別描繪如下負載要素- 「CPU歷史」,「記憶體和Swap歷史」,「網絡歷史」。如果你懸停鼠標指針到每個部分的,你會看到帶有顏色的詳細分析。
 |
 |
 |
進程表
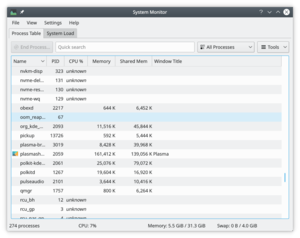
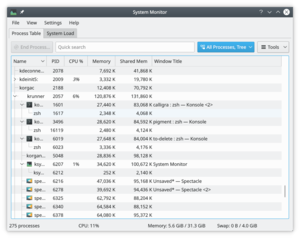
The view by default gives you an alphabetical order list of all processes running. Clicking on any column header will make this the sort column. If you have a runaway process you will find the view most useful. You can also elect to see sub-sets of the processes, by owner or program.
 |
 |
Hints and Tips
Ctrl + Esc brings up the Processes part of KSysGuard, which is very helpful when you are trying to find which application is using too many resources.
In KRunner (Alt + F2 or from a right-click on the desktop) there is a tiny icon to the left of the entry bar - it looks like a microwave oven - that also brings up the Process Table.
