Kexi/Tutorials/Drilling Down on Facebook Data/uk: Difference between revisions
Created page with "<br style="clear: both" /> Як можна бачити з зображення, маємо проблему із тим, що заголовок звіту займає ко..." |
Created page with "На цьому можна завершити опис деяких із можливостей '''Kexi 2.2'''. З іншими можливостями можна ознай..." |
||
| Line 217: | Line 217: | ||
Як можна бачити з зображення, маємо проблему із тим, що заголовок звіту займає комірку із іншими заголовками полів. Причиною є те, що він перебуває у тому самому розділі. Виправити це доволі просто: розташуйте заголовок в окремому розділі, наприклад «Заголовок сторінки». | Як можна бачити з зображення, маємо проблему із тим, що заголовок звіту займає комірку із іншими заголовками полів. Причиною є те, що він перебуває у тому самому розділі. Виправити це доволі просто: розташуйте заголовок в окремому розділі, наприклад «Заголовок сторінки». | ||
На цьому можна завершити опис деяких із можливостей '''Kexi 2.2'''. З іншими можливостями можна ознайомитися за допомогою безпосереднього користування програмою. Якщо можете, удоскональте документацію, посилання на яку наведено на сторінці програми<ref>[[Special:myLanguage/Kexi|Kexi]]</ref>, або долучайтеся до команди розробників за допомогою каналів #kexi та #calligra на сервері freenode IRC. | |||
Посилання на додаткові джерела інформації | Посилання на додаткові джерела інформації | ||
Revision as of 10:42, 7 June 2019
Вступ
За допомогою цієї статті ви зможете ознайомитися з цілим діапазоном понять, що використовуються у Kexi, програмі для керування базами даних комплексу програм Calligra. У Kexi ви зможете скористатися багатьма можливостями, від створення простих таблиць та запитів до створення складних звітів та обробки даних за допомогою скриптів. Метою написання цієї статті було показати новим та досвідченим користувачам, наскільки корисною може бути Kexi.
Розробка Kexi 2 тривала 3 роки від часу появи Kexi 1.6. Версії для KOffice 2.0 та 2.1 не було взагалі випущено через брак розробників. Розробка Kexi виконується у дусі вільного програмного забезпечення, лише коли у її розробників є вільна хвилинка, як хобі. Розробники сподіваються, що цей випуск є достатньо стабільним для повсякденного використання і буде доброю основою для майбутніх випусків.
Щоб ці настанови були корисними, варто використати у них якийсь корисний приклад. Авторові цих настанов, як власникові сторінки Kexi у Facebook[1], доводиться щотижня отримувати електронною поштою повідомлення з різноманітними статистичними даними. Отже, у цій статті ми спробуємо розібратися, як отримати дані з цих повідомлень та внести їх до бази даних Kexi з метою створення звітів на основі запитів та стеження за тенденціями у даних.
Необроблені дані
Для внесення даних до бази автором було експортовано вибірку повідомлень електронної пошти з KMail. У результаті було створено файл .mbox, який є текстовим файлом, що містить усі повідомлення електронної пошти. Можна було б вручну обробити кожне повідомлення та ввести його дані до таблиці, але оскільки автор вже мав певний досвід, йому хотілося автоматично зібрати дані, а це чудовий виклик з написання скрипту у Kexi для виконання цього завдання.
Починаємо, створюємо базу даних і таблицю
Якщо Kexi не встановлено у вашій системі, подивіться, чи доступна програма серед оновлень у вашій програмі для керування пакунками. Якщо пакунка з програмою там не буде, вам доведеться встановлювати програму з початкового коду за допомогою настанов щодо встановлення Calligra[2] або вікі KDE[3].
I start by launching Kexi and selecting to create a from the startup wizard. Depending on the installed plugins, you will be able to create a database stored as a file, or on an existing database server such as PostgreSQL or MySQL. Selecting to have it stored in a file as this is easiest for new users and is appropriate when there will be a limited number of users accessing the database at any one time. Kexi file-based databases use sqlite as the underlying format and so are readable by any sqlite compatible program.
The database requires a name, I chose kexi_facebook, followed by a location to save it, the default is fine. I was then be presented by the main Kexi window. The main window contains a toolbar along top, and a project navigator down the left hand side. The main toolbar in Kexi is different to the other Calligra applications and uses a tab bar style layout. Each window that is opened also has a local toolbar for options that are specific to that window, such windows are table, query, form, report and script.
На вкладці навпроти головного меню виберемо пункт , щоб запустити дизайнер таблиць.
До статистичних даних, які ви отримаєте електронною поштою, буде включено дату, кількість нових підписників, кількість дописів на стіні, кількість відвідань та загальну кількість підписників. Отже, можна створити таблицю із такою схемою:
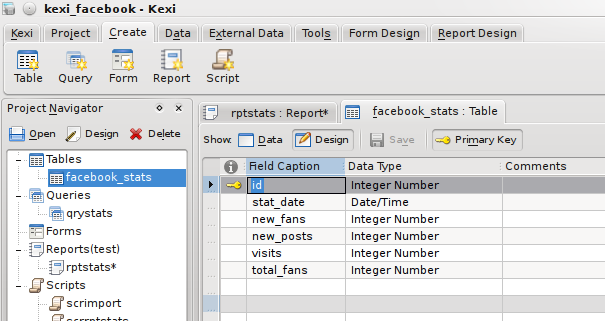
The fields have a name, type and comment, and also several properties available from the property editor on the right hand side such as constraints and a default value if none is given. Each object in the database will have numerous properties associated with it, and the property editor allows these to be displayed and edited in a single location.
У відповідь на перемикання до режиму перегляду даних програма попросить зберегти таблицю і покаже вікно редактора таблиць, за допомогою якого ви можете ввести запис вручну. Але нам потрібно зробити зовсім інше!
Отримуємо дані
Нам потрібно автоматично отримати дані до нашої новоствореної, але порожньої, таблиці. Як ми вже згадували раніше, дані зберігаються у окремому файлі .mbox, де містяться усі повідомлення електронної пошти. У Kexi передбачено підтримку скриптів, які можна написати на ecmascript (javascript), python або декількох інших мовах, підтримку яких передбачено у Kross, оболонці для скриптових мов KDE. Ми напишемо скрипт на qtscript, тобто, фактично, на javascript, оскільки автор знає цю мову досконаліше за python.
My script had to open the .mbox file, read it line by line, grabbing the data it needed using string manipulation, and when a full set of data was read, add it as a record to the database. Scripts not only have access to built-in methods and Kexi specific methods, but can also import libraries containing large amounts of useful functions, the most useful being the QT libraries. I will use the Core functions to have access to the filesystem using QTextStream for reading data, and the Gui functions for access to QMessageBox to be able to present errors in a dialog if they occur.
На вкладці меню цього разу виберемо . У відповідь буде запущено редактор скриптів у центральній частині вікна і редактор властивостей праворуч.
Скрипт має лише декілька властивостей: тип та інтерпретатор. Нам потрібен інтерпретатор qtscript і тип — «Виконуваний файл». Виконуваним є той скрипт, який має бути запущено вручну. Скрипт модуля — скрипт, який має містити загальний модуль коду, доступ до якого отримуватимуть інші скрипти, а скрипт об'єкта — скрипт, який пов'язано із іншим об'єктом бази даних, зокрема звітом.
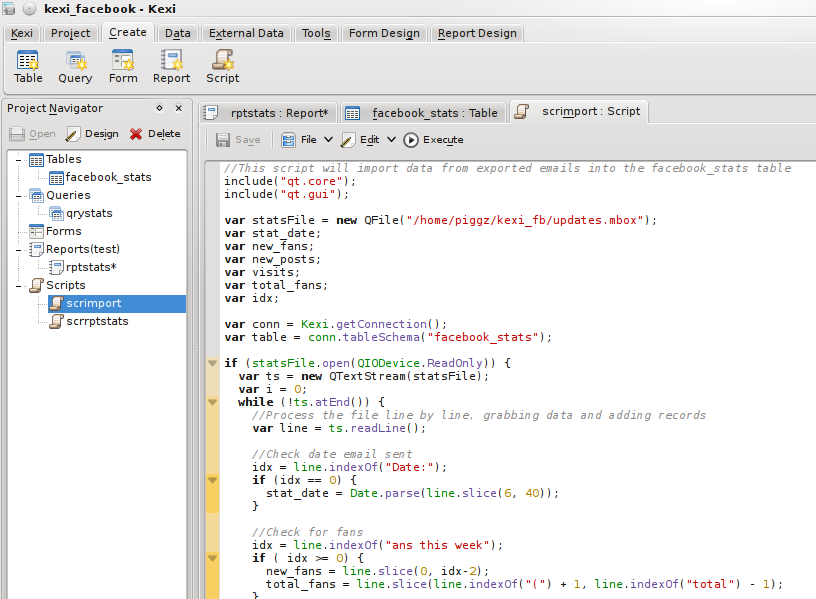
Увесь скрипт є таким:
//This script will import data from exported emails into the facebook_stats table
include("qt.core");
include("qt.gui");

var statsFile = new QFile("/home/piggz/kexi_fb/updates.mbox");
var stat_date;
var new_fans;
var new_posts;
var visits;
var total_fans;
var idx;

var conn = Kexi.getConnection();
var table = conn.tableSchema("facebook_stats");

if (statsFile.open(QIODevice.ReadOnly)) {
  var ts = new QTextStream(statsFile);
  var i = 0;
  while (!ts.atEnd()) {
    //Process the file line by line, grabbing data and adding records
    var line = ts.readLine();

    //Check date email sent
    idx = line.indexOf("Date:");
    if (idx == 0) {
      stat_date = Date.parse(line.slice(6, 40));
    }

    //Check for fans
    idx = line.indexOf("ans this week");
    if ( idx >= 0) {
      new_fans = line.slice(0, idx-2);
      total_fans = line.slice(line.indexOf("(") + 1, line.indexOf("total") - 1);
    }

    //Check for wall posts
    idx = line.indexOf("all posts");
    if (idx >= 0) {
      new_posts = line.slice(0, idx-2) + 0;
    }

    //Check for visits
    idx = line.indexOf("isits to your");
    if (idx >= 0) {
      visits = line.slice(0,idx-2);

      //Should have all the data now so insert a record

      stat_date = new Date(stat_date);
      var short_date = stat_date.getFullYear() + "-" + pad(stat_date.getMonth() + 1, 2) + "-" + pad(stat_date.getDate(), 2);

      if (!conn.insertRecord(table, [++i, short_date, new_fans, new_posts, visits, total_fans])) {
	var msg = "Cannot insert into " + table.caption() + '\n';
	msg += "Date: " + stat_date.toDateString() + " " + short_date + '\n';
	msg += "New Fans: " + new_fans + '\n';
	msg += "Total Fans: " + total_fans + '\n';
	msg += "New Posts: " + new_posts + '\n';
	msg += "Visits: " + visits;

	QMessageBox.information(0,"Error", msg);
      }
    }
  }
  QMessageBox.information(0, "Records Added:", i);
}

statsFile.close();

function pad(number, length) {
  var str = '' + number;
  while (str.length < length) {
    str = '0' + str;
  }
  return str;
}
A possible bug in the above script is that it assumes there are no current records in the table, and creates primary keys starting at 1. It is OK to run the script once, but if it is run again, it won't overwrite records that have an ID matching what it is trying to insert. To make it more robust, it would need to first find out the current maximum of the ID field. This would be a good exercise to get used to writing scripts.
Після виконання скрипту за допомогою панелі інструментів буде зібрано 11 записів даних, які буде показано на панелі табличних даних.
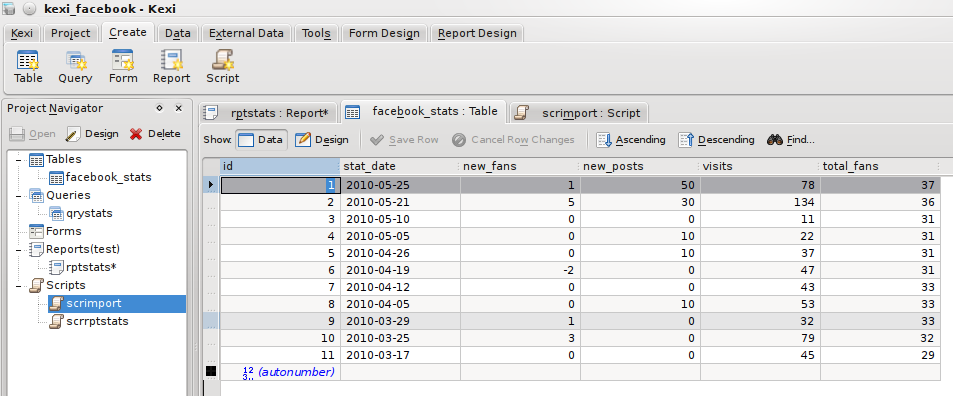
Its worth pointing out that the above script took a lot of trial and error as it is not initially obvious that it is possible to import extra libraries or use Kexi specific functions. One thing that needs to be worked on is documentation to make this easier for new users, submissions are very welcome at the KDE UserBase website.
Упорядковуємо дані, створюємо запит
At the moment, the data is ordered in whatever order it came out of from KMail, I need it to be in ascending date order, so I created a query to sort it. From the tab, this time I chose . I wanted all fields except the auto-incrementing primary key, so I set it up as:
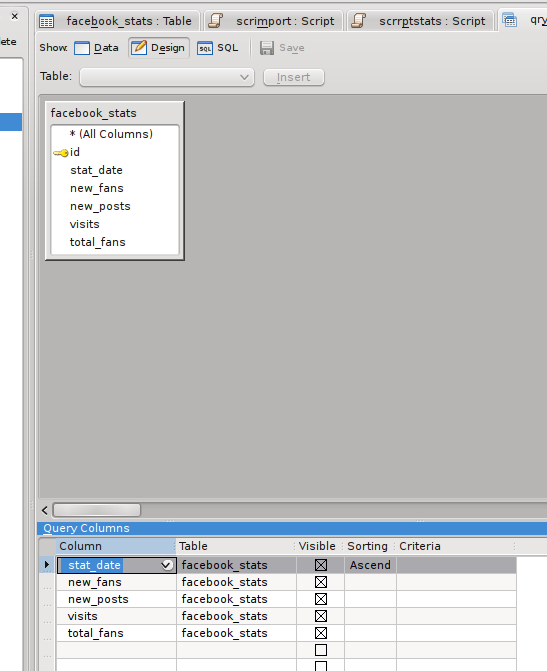
Перемикання на панель «Перегляд даних» призведе до виконання запиту і показу результатів:
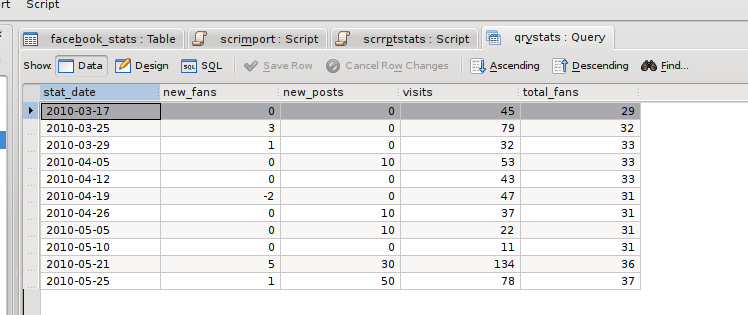
Збережемо запит як qryStats для використання у звіті.
Упорядкування даних за допомогою звіту
A new feature of Kexi 2 is the report plugin. This allows reports to be designed and executed directly within Kexi using a GUI editor similar to report designers in other database systems such as Microsoft Access, Crystal Reports or Oracle Reports. In Kexi 1.6, reports were available as a separate add-on from kde-apps.org, but it did not contain as many features as the version in Kexi 2, and was not fully integrated with the application as the designer was an external program.
Reports can be printed, saved as a PDF, exported to HTML or OpenDocument Spreadsheet files or just remain in the database for live viewing. It is possible to save the report in all these formats because of the two-stage generation process; reports are firsts rendered into an intermediate description, and this description is used to generate the final version in whatever format is selected. In a future version, it is likely that extra formats will be supported such as OpenDocument Text and XML, suitable for further processing using XSLT.
From the tab I choose to create a blank report with a single 'Detail' section. The structure of a report is based around Sections, these can be page headers or footers, report header or footer, or Group sections where data is grouped on a field value.
Initially, all I want is a simple tabular view of the data, so all the fields will go into the detail section, apart from a header, and the field titles, which must go either in a Page Header or Report Header. From the Section Editor on the report toolbar, I added a Report Header, and using the tab on the menu bar, added fields and labels to create the report layout. From the tab on the sidebar, I set the reports data source to the qryStats query I created above. Finally, I set the Control Source property of each field item to the corresponding field in the query, and the Caption of the labels appropriately. It looked like this in the end:
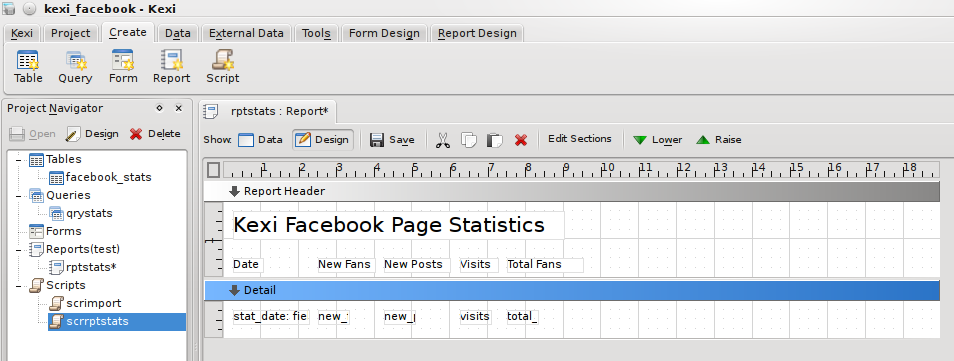
і дає такий звіт:
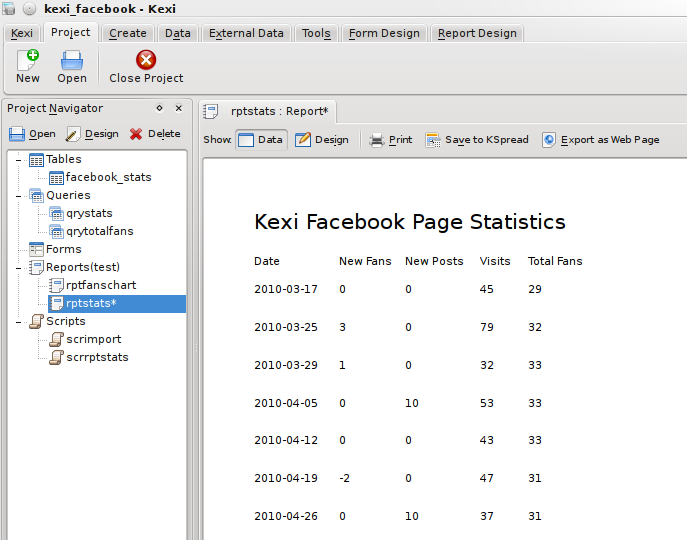
This gets the job done, but isn't quite as 'jazzed up' as I would like. It's common in desktop applications to alternate the background color of rows to make it more obvious where each set of data begins and ends, so let's try that.
I created another script, but this time set its type to 'Object', as it is to be associated with the report object. Report scripts are event-driven, that is, whenever a certain event occurs in the generation of the report, the associated code in the script is called. Report scripts use the features of Kross::Object, where each object in a report can be associated with a script object, making it more object-oriented in nature. Each script object can have its own variables and functions. Report objects can be the report itself, or any of the report sections. To make it more clear, the final script looks like:
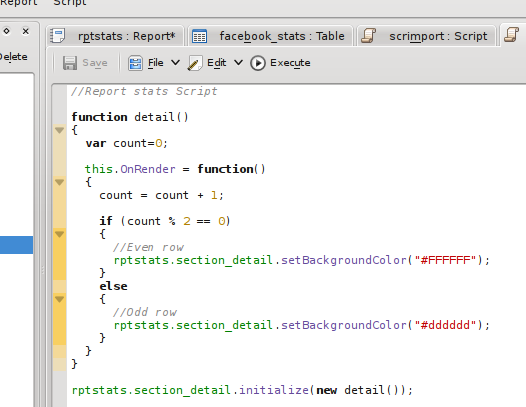
This is quite a simple script, there is an object called detail, containing a function OnRender, which will be called whenever a detail section is rendered. The function keeps track of how many times it has need called, and alternates the background colour. The final line of the script associates the detail function with the detail section of the report.
Then, in the report, I set the Interpreter Type to qtscript and the Object Script property to the name of the script. It is important that the Interpreter type of both the report and script match, otherwise the script won't be presented as an option in the Object Script list.
Створений звіт виглядатиме так:
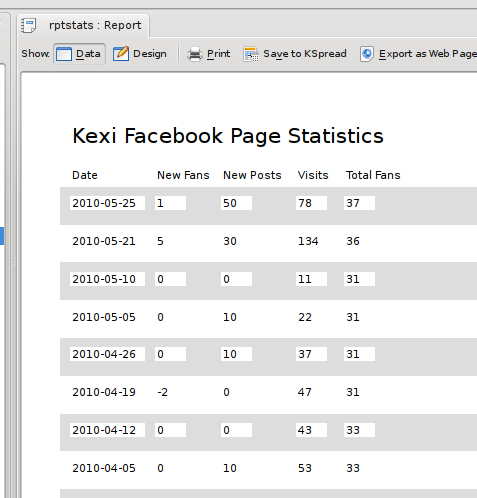
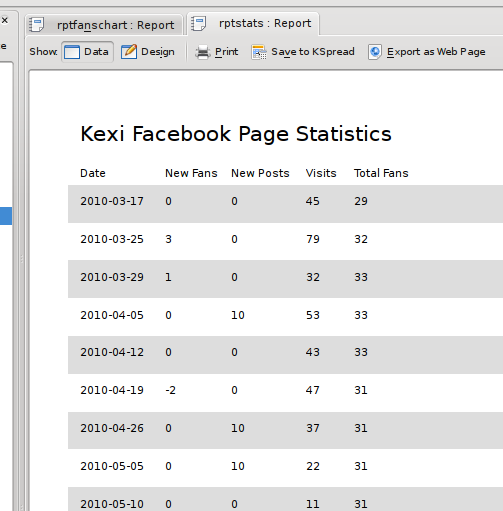
Not so great with the white background on the fields, so back in the designer, I changed the Opacity property of each of the fields to 0 to make them transparent, resulting in a more reasonable:
Додавання чогось трендового
My final requirement at this stage was to have something more graphical; a nice chart to show the trend of fans we have over time. The report designer allows the creation of charts using the KDChart library from KDAB and is used in the Calligra program KChart. It can be quite powerful, allowing the joining of chart data to the main report data (called master-child links), but for now, all I needed was a simple, single chart. The chart object expects data in a certain format. There must be 2 or more columns of data. The first column is used for the labels on the X axis, all other columns are used as series in the chart. I started by creating a query with 2 columns, date in ascending order and total fans, then created a new report. The report itself is not based on any data, so its Data Source was left empty. An empty data source will produce a report with 1 detail section, providing an area to add a minimal set of items to a report.
У розділі подробиць додамо об'єкт діаграми з панелі інструментів редактора звітів і встановимо для його джерела даних щойно створений запит
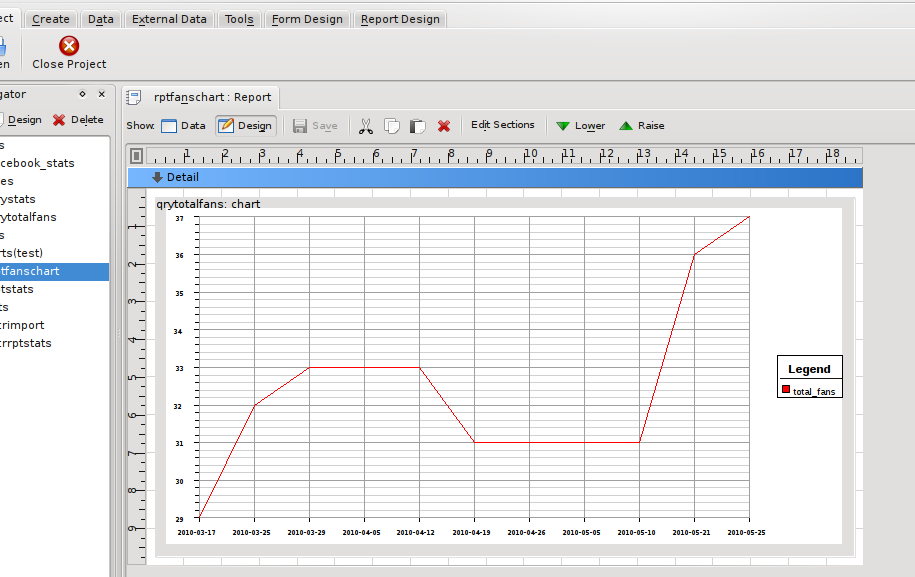
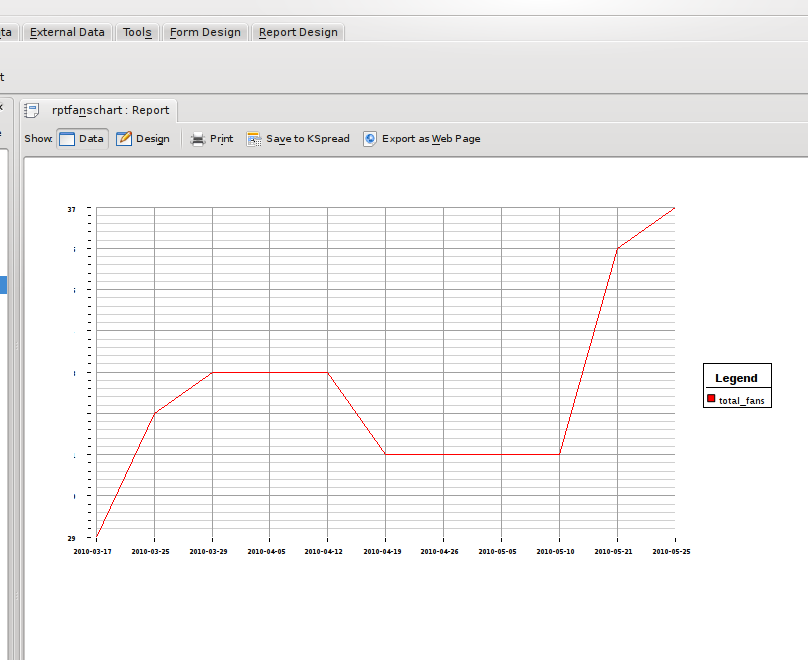
Як ви можете бачити, навіть під час розробки об'єкт діаграми може збирати дані та малювати попередній варіант діаграми. У результаті перемикання на панель даних буде показано діаграму без будь-яких додаткових ліній та тексту з дизайнера:
Матеріальні копії
When printed, both the tabular report and chart report look as they do in the Data view. When printed using the PDF printer option in KDE, the chart even retains all its detail, as it is not converted to a bitmap, but saved as lines which makes it completely zoomable!
Saving the tabular report as an HTML document produces 2 options, saving as a table, or using CSS. The table option produces an HTML file where the text from each field in a report is saved as a table cell, and each section is a row. The CSS options use the <div> attribute and try to create an HTML file that closely resembles the original, allowing text and images to be rendered at arbitrary positions.
Табличний звіт також чудово експортується до файла електронної таблиці OpenDocument для використання у Calligra Sheets або Libre Office:
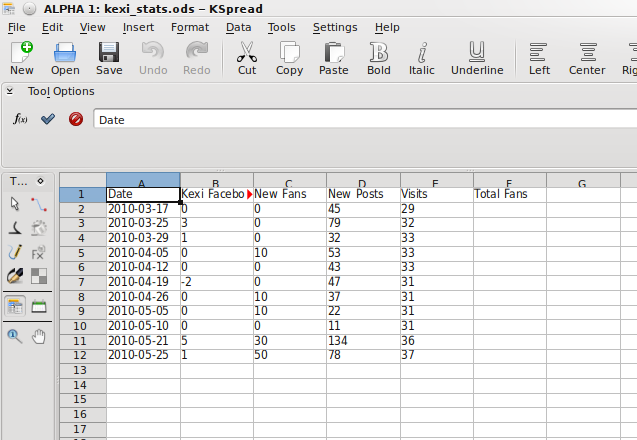
Як можна бачити з зображення, маємо проблему із тим, що заголовок звіту займає комірку із іншими заголовками полів. Причиною є те, що він перебуває у тому самому розділі. Виправити це доволі просто: розташуйте заголовок в окремому розділі, наприклад «Заголовок сторінки».
На цьому можна завершити опис деяких із можливостей Kexi 2.2. З іншими можливостями можна ознайомитися за допомогою безпосереднього користування програмою. Якщо можете, удоскональте документацію, посилання на яку наведено на сторінці програми[4], або долучайтеся до команди розробників за допомогою каналів #kexi та #calligra на сервері freenode IRC.
Посилання на додаткові джерела інформації
- ↑ kexi.project
- ↑ [community.kde.org/Calligra/Building Building Calligra]
- ↑ Build KDE4
- ↑ Kexi


