RKWard/uk: Difference between revisions
Created page with "== Режими роботи ==" |
Created page with "'''RKWard''' можна використовувати у два різних способи: як звичайне IDE, тобто писати код, який буде вбу..." |
||
| Line 27: | Line 27: | ||
== Режими роботи == | == Режими роботи == | ||
'''RKWard''' | '''RKWard''' можна використовувати у два різних способи: як звичайне IDE, тобто писати код, який буде вбудовано до програм або скриптів або у режимі інтерактивного сеансу, коли код виконується негайно (основний спосіб роботи програмістів мовою R). Можна також поєднувати використання обох способів. | ||
== Interactive interpreter == | == Interactive interpreter == | ||
Revision as of 10:47, 21 July 2011
Огляд
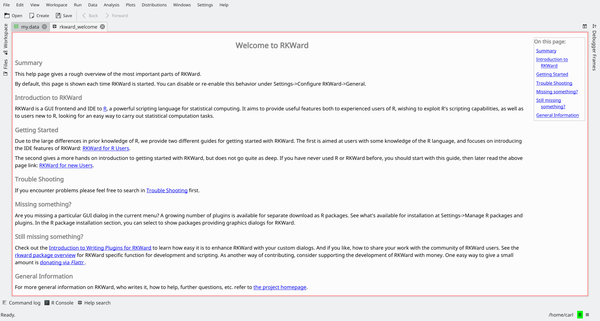
RKWard — комплексне середовище розробки (IDE), побудоване на основі платформи для розробки KDE для програмування мовою R, основним призначенням якої є обробка статистичних даних,
Можливості
- Середовище розробки з підсвічуванням синтаксичних конструкцій, доповненням коду, панеллю перегляду об’єктів та редагування даних.
- Прозорий інтерфейс до R.
- Графічні інструменти для доступу до статистичних та графічних функцій R.
- Вбудована функціональна можливість запитів R для створення циклу читання-обчислення-друк (read-eval-print-loop або REPL).
- Можливість керування пакунками R.
- Завантаження та збереження станів робочих аркушів R.
- Можливість розширення за допомогою додатків мовою ECMAscript (Javascript).
Режими роботи
RKWard можна використовувати у два різних способи: як звичайне IDE, тобто писати код, який буде вбудовано до програм або скриптів або у режимі інтерактивного сеансу, коли код виконується негайно (основний спосіб роботи програмістів мовою R). Можна також поєднувати використання обох способів.
Interactive interpreter
RKward offers an integrated R prompt which can be used in a so-called "read-eval-print-loop" (REPL) way.

The prompt is by all intents and purposes identical to the R console prompt, with some additional capabilities. For example, along with function name completion, it supports calltips (pop-up boxes which show a function's signature) and also various way of copying and pasting the code.
This way operates like a normal R session: commands are inputted, output and other objects are created, and results can be shown or saved to disk using R's own functions.
Programming in RKward
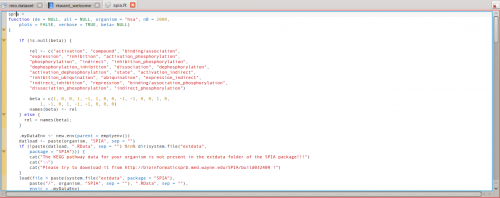
Programming in RKWard is done like in any other IDE: the code editor offers completion, syntax highlighting, and calltips. The code editor however offers additional functions that can be used in an interactive session. Specific commands can be issued to execute all the currently loaded code, or only the selected code: this is particularly useful when writing functions to be then prototyped in an interactive session.
Taking a look at R objects
Since working in R often involves loading "libraries" (add-on packages) and creating multiple objects, RKward offers an interface to inspect and show the objects loaded in memory by R.
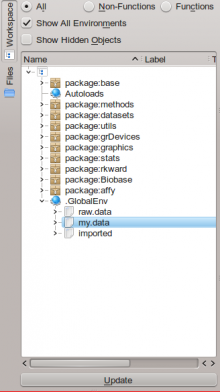
The object browser allows access to both R's global environment and the packages's own environment. Additional information are available either as tooltips or by double-clicking items, which will open a new tab in RKWard's interface showing information on the object in question.
Data manipulation
Along with code aids, RKward has a way to handle data directly from the program. In particular, one can view matrices and data frames (R's own definition of data tables) in the interface, or create new ones.
Existing data can be imported: RKWard supports text files (TSV/CSV) and also data from widely used statistics programs such as STATA or SPSS.
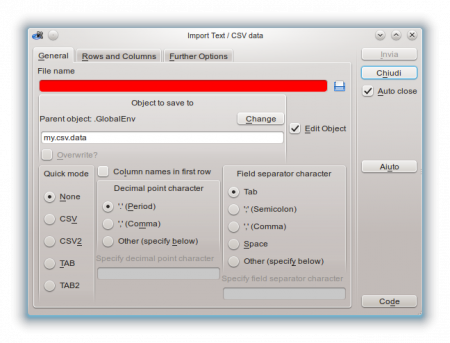
The interface can show the column names, the types of the columns (numbers, strings, etc.) and the data itself, using a spreadsheet-like user interface.
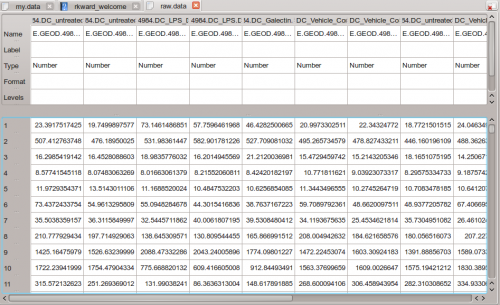
There is direct support for editing and data manipulaiton: for example, adding rows or columns, changing row headers, and also the data type of the columns themselves, acting like a simplified spreadsheet.
Interactive statistics and plotting
RKWard offers simplified front-ends to a number of R's statistical functions and to generate graphs for data. These can be accessed from the Analysis, Plots and Distributions menus.
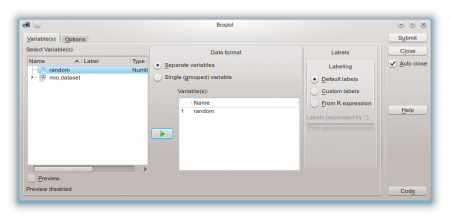
For example, many type of plots can be executed through the functions in the aforementioned menus. Each function (as the example above shows) has its dedicated configuration dialog, where any compatible object from R's global namespace can be used. Also the dialogs offer shortcuts to specific plot or analysis options. Results are then output in HTML form in RKWard's main window, where they can be exported or saved.
