LabPlot: Difference between revisions
Appearance
No edit summary |
|||
| Line 27: | Line 27: | ||
== Documentation == | == Documentation == | ||
* Quick Start | * [[Special:myLanguage/LabPlot/QuickStart|Quick Start]] | ||
* User Guide | * [[Special:myLanguage/LabPlot/UserGuide|User Guide]] | ||
* Tutorials | * [[Special:myLanguage/LabPlot/Tutorials|Tutorials]] | ||
* FAQ | * [[Special:myLanguage/LabPlot/FAQ|FAQ]] | ||
== More Information == <!--T:9--> | == More Information == <!--T:9--> | ||
Revision as of 20:06, 13 August 2020

|
LabPlot is an application for interactive graphing and analysis of scientific data. LabPlot provides an easy way to create, manage and edit plots and to perform data analysis. |
Introduction
LabPlot supports 2D-plotting, data analysis (e.g Fourier transformation, Linear and non-linear regression analysis), computing with computer algebra systems (CAS) like Maxima and GNU Octave and importing and exporting to many formats.
A complete list of LabPlot features is available in LabPlot webpage.
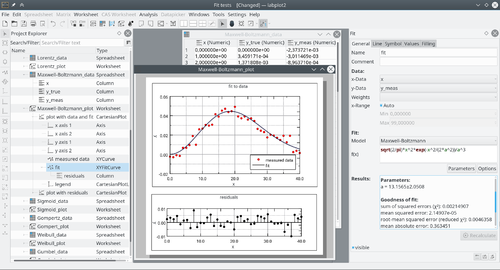
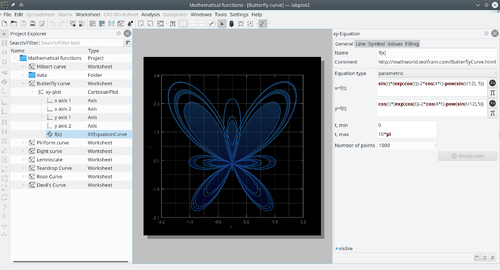
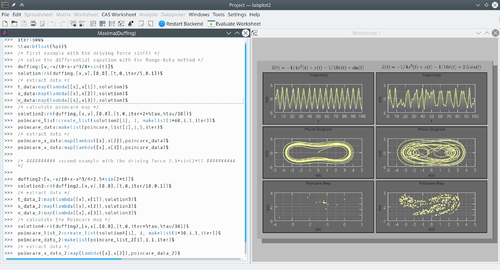
Screenshots


More screenshots can be viewed at LabPlot webpage.
