LabPlot/fr: Difference between revisions
ChristianW (talk | contribs) (Created page with "Une liste complete des fonctionnalités LabPlot est disponible sur les [https://labplot.kde.org/features/ pages web LabPlot].") |
ChristianW (talk | contribs) (Created page with "D'autres exemples d'écrans sont disponibles sur les [https://labplot.kde.org/gallery/ pages web de LabPlot].") |
||
| Line 18: | Line 18: | ||
[[File:Labplot2 appdata 03.png|500px|thumb|center]] | [[File:Labplot2 appdata 03.png|500px|thumb|center]] | ||
D'autres exemples d'écrans sont disponibles sur les [https://labplot.kde.org/gallery/ pages web de LabPlot]. | |||
== Documentation == | == Documentation == | ||
Revision as of 11:24, 10 September 2020
Introduction
LabPlot supports 2D-plotting, data analysis (e.g Fourier transformation, Linear and non-linear regression analysis), computing with computer algebra systems (CAS) like Maxima and GNU Octave and importing and exporting to many formats.
Une liste complete des fonctionnalités LabPlot est disponible sur les pages web LabPlot.
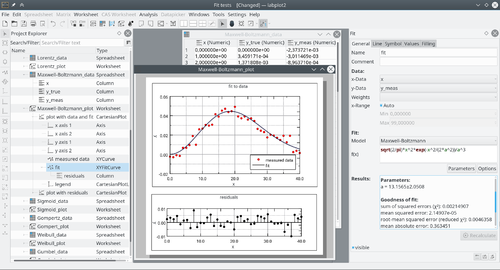
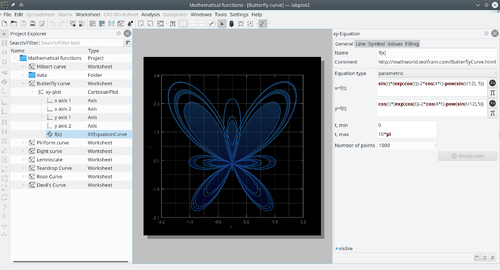
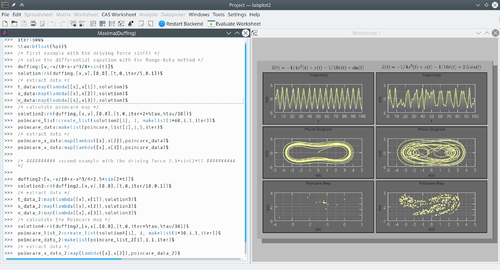
Captures d'écran


D'autres exemples d'écrans sont disponibles sur les pages web de LabPlot.

