Plasma/NetworkMonitor/uk: Difference between revisions
(Created page with 'Протягом періоду, коли не відбувається передавання даних, низька активність у мережі формує граф...') |
(Created page with '300px|thumb|center|Низький рівень активності') |
||
| Line 13: | Line 13: | ||
Протягом періоду, коли не відбувається передавання даних, низька активність у мережі формує графік з активністю у 1 або 2 кілобіти на секунду у всьому діапазоні даних. | Протягом періоду, коли не відбувається передавання даних, низька активність у мережі формує графік з активністю у 1 або 2 кілобіти на секунду у всьому діапазоні даних. | ||
[[File:NetScaling1.png|300px|thumb|center| | [[File:NetScaling1.png|300px|thumb|center|Низький рівень активності]] | ||
Then, a spike of activity happens, and the scaling resets so that the spike sets the graph scale and the low level activity becomes a ripple at the bottom of the scale. | Then, a spike of activity happens, and the scaling resets so that the spike sets the graph scale and the low level activity becomes a ripple at the bottom of the scale. | ||
Revision as of 12:38, 18 September 2010
Віджет монітора мережі
 |
Віджет монітора мережі. За допомогою цього віджета ви зможете спостерігати за обміном даними мережею. |
Дуже простий віджет призначений для показу обміну даними вашими мережевими з’єднаннями.
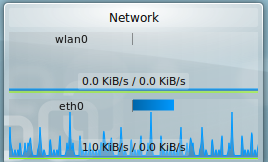
Для кожного зі встановлених вами мережевих з’єднань буде показано графік, який оновлюватиметься кожні 2 секунди. Масштаб графіка автоматично змінюватиметься відповідно до найвищого рівня обміну даними протягом циклу (цикл триває декілька хвилин). Тому протягом періодів, коли обмін не здійснюється, на моніторі буде показано найнижчий рівень підтримки з’єднання (обмін даними з маршрутизатором для підтримки з’єднання).
Протягом періоду, коли не відбувається передавання даних, низька активність у мережі формує графік з активністю у 1 або 2 кілобіти на секунду у всьому діапазоні даних.

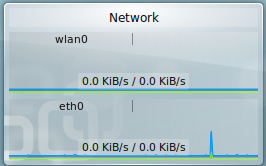
Then, a spike of activity happens, and the scaling resets so that the spike sets the graph scale and the low level activity becomes a ripple at the bottom of the scale.

That spike moves across the display over a period of several minutes. When the spike cycles off the display, the scaling changes, suddenly, to show the low level of activity at full scale. The sudden "appearance" of activity all across the graph can make a person think that the network is behaving strangely. It isn't.
There are settings. You can choose to change which network interfaces show. In the example images both the wired ethernet (eth0) and Wireless (wlan0) connections show, but I could have turned off the wireless while not using it.

