KDbg
 |
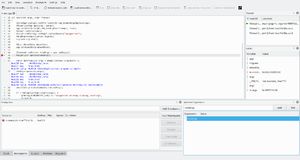
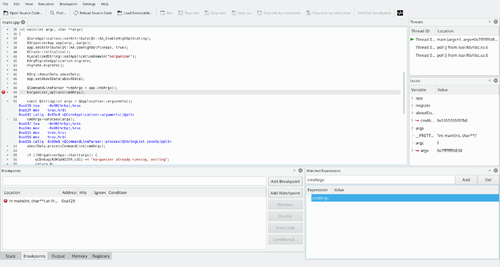
KDbg is a graphical tool for debugging your programs |
Features

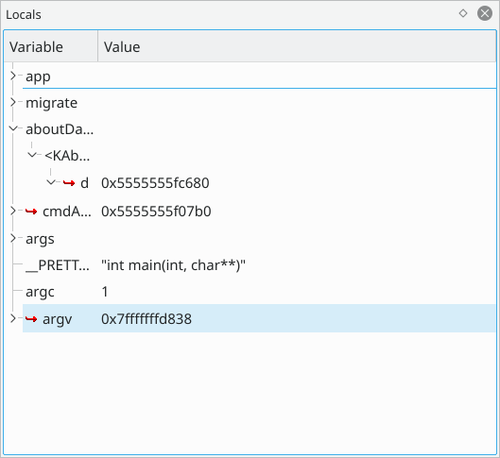
- Inspection of variable values in a tree structure.
- Direct member: For certain compound data types the most important member values are displayed next to the variable name, so that it is not necessary to expand the subtree of that variable in order to see the member value. For example, you don't need to go into a variable of type QString if you want to see the string that the variable holds. (BTW, this is of course not hardcoded, but can be extended to new types.) KDbg can even display Qt's QString values, which are Unicode strings.
- Debugger at your finger tips: The basic debugger functions (step, next, run, finish, until, set/clear/enable/disable breakpoint) are bound to function keys F5 through F10. Quick and easy.
- Of course, lots of other basic functions: View source code, search text, set program arguments and environment variables, display arbitrary expressions. Everything you need to debug a program!
- Debugging of core dumps, attaching to running processes is possible.

The project home page gives more details.
A User Manual is available on the project website.
![]() Support for this application can be found from the project's home page
Support for this application can be found from the project's home page
