KChart
 |
Lav diagrammer, som kan indlejres i dine dokumenter og præsentationer |
History
KChart was the charting tool from KOffice and is still the charting tool from Calligra. In older version, KChart was a standalone application, now it's a part with KGantt of the KDiagram library used by other KDE applications (e.g. Calligra and KMyMoney)[1].
Features
Hovedpunkter
- Let at anvende
- Alle standardværdier er relative til vinduets størrelse
- Alle parametre kan redigeres efter, at diagrammet er tegnet
- Valgmuligheder for placering af forklaring
- Skrifttypen i sidehoved og sidefod kan defineres uafhængigt af andre skrifttyper

- Mange diagramtyper
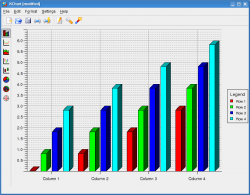
- Søjle: normale | stablede | procent, 2D | 3D-udseende
- Line: normale | stablede| procent, line markers
- Area: normale | stablede | procent
- HøjLav: normale | åben-lukket
- Boksplot
- Cirkel (Lagkage): normale | adskildt, 2D | 3D
- Krans
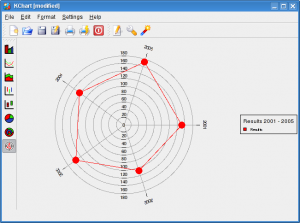
- Polær (Radar): normale | stablede | procent
