KDevelop4/Manual/Debugging programs
Debugging programs in KDevelop
Once you have a launch configured (see Running programs), you can also run it in a debugger: Select the menu item , or hit F9. If you are familiar with gdb, the effect is the same as starting gdb with the executable specified in the launch configuration and then saying "run". This means that if the program calls abort() somewhere (e.g. when you run onto a failing assertion) or if there is a segmentation fault, then the debugger will stop. On the other hand, if the program runs to the end (with or without doing the right thing) then the debugger will not stop by itself before the program is finished. In the latter case, you will want to set a breakpoint on all those lines of your code base where you want the debugger to stop before you run the debug launch. You can do that by moving the cursor on such a line and selecting the menu item , or right-clicking on a line and selecting from the context menu.

Running a program in the debugger will put KDevelop in a different mode: it will replace all the "Tool" buttons on the perimeter of the main window by ones that are appropriate for debugging, rather than for editing. You can see which of the mode you are in by looking at the top right of the window: there are tabs named "Review", "Debug", and "Code"; clicking on them allows you to switch back and forth between the three modes; each mode has a set of tool views of its own, which you can configure in the same way as we configured the "Code" tools above.
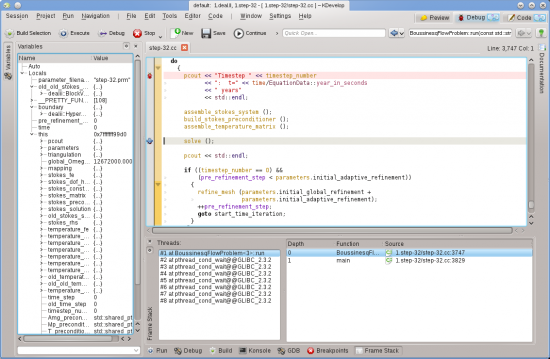
Once the debugger stops (at a breakpoint, or a point where abort() is called) you can inspect a variety of information about your program. For example, in the image at the right, we have selected the "Frame stack" tool at the bottom (roughly equivalent to gdb's "backtrace" and "info threads" commands) that shows the various threads that are currently running in your program at the left (here a total of 8) and how execution got to the current stopping point at the right (here: main() called run(); the list would be longer had we stopped in a function called by run() itself). On the left, we can inspect local variables including the current object (the object pointed to by the this variable).
From here, there are various possibilities you can do: You can execute the current line (F10, gdb's "next" command), step into the functions (F11, gdb's "step" command), or run to the end of the function (F12, gdb's "finish" command). At every stage, KDevelop updates the variables shown at the left to their current values. You can also hover the mouse over a symbol in your code, e.g. a variable; KDevelop will then show the current value of that symbol and offer to stop the program during execution the next time this variable's value changes. If you know gdb, you can also click on the "GDB" tool button at the bottom and have the possibility to enter gdb commands, for example in order to change the value of a variable (for which there doesn't currently seem to be another way).
