Kdenlive/Manual/View Menu/Audio Spectrum
Appearance
Audio Spectrum
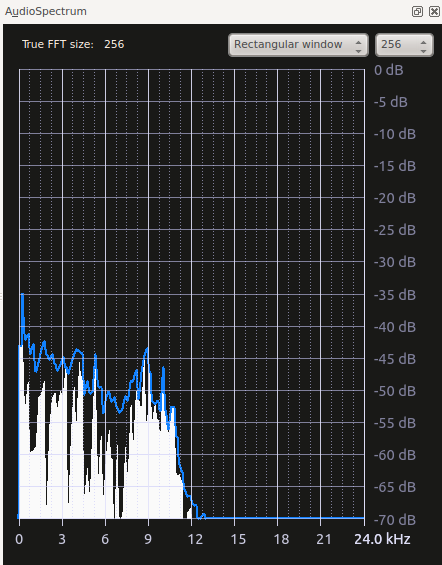
This allows you to monitor the audio properties of your clip in detail.
It graphs the loudness of the audio (in decibels - vertical axis) for each audio frequency (horizontal axis) in the current frame. The blue curve is +- the maximum over the previous few samples.
See also Spectrogram scope which displays a graphical representation of the audio spectrum over the entire clip.
For more information see Granjow's blog on Audio Spectrum

