RKWard
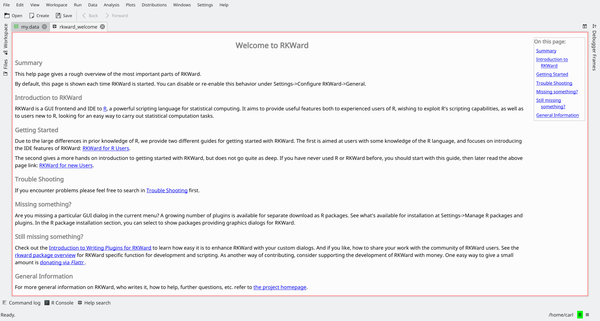
Présentation
RKWard est un environnement de développent intégré (EDI ou IDE pour integrated development environment) construit sur la plateforme de développement KDE pour le langage de programmation R , un langage de script très orienté vers les statistiques et la manipulation de données.
Fonctionnalités
- Environnement de développement avec coloration syntaxique, complétion de code, navigateur d'objets, navigateur d'aide
- Interface transparente vers R
- Outils graphiques pour accéder aux fonctions statistiques et de visualisation de R.
- Éditeur de données intégré
- Console R interactive intégrée
- Gestion des paquets R
- Chargement/Enregistrement des états de l'espace de travail de R
- Extensible via les modules externes ECMAscript
Utilisation de RKWard comme EDI pour R
R est un langage interprété, et RKWard permet d'utiliser le langage R de manière interactive, de façon similaire à une console R 'normale', mais avec des fonctionnalités supplémentaires comme la coloration syntaxique et la possibilité de coller des données issues de tableurs. De plus, RKWard offre des fonctionnalités typiques des EDI : Un éditeur de script intégré, un navigateur de fichiers, un visualiseur d'objets, etc.
Interprète interactif
RKward offre une invite de commande R intégrée qui peut être utilisée pour travailler de manière interactive avec le moteur R.

L'invite de commande est à toutes fins pratiques identique à l'invite de la console R, avec quelques fonctionnalités supplémentaires. Par exemple, en plus de la complétion du nom de la fonction, il supporte les " calltips " (boites contextuelles qui affichent la signature d'une fonction) ainsi que diverses façons de copier et coller le code.
Ce mode fonctionne comme une session R normale : des commandes sont entrées, des sorties et d'autres objets sont créés, et les résultats peuvent être affichés ou enregistrés sur le disque en utilisant les fonctions propres à R.
Programmer avec RKward
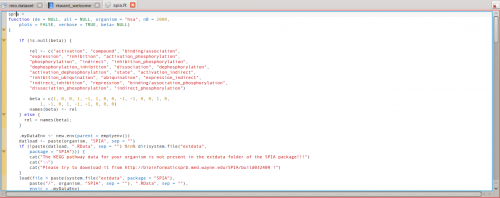
Programmer avec RKWard' se fait comme avec n'importe quel autre EDI : l'éditeur de code offre la complétion, la coloration syntaxique, et les 'calltips'. L'éditeur de code offre cependant des fonctions supplémentaires qui peuvent être utilisées dans une session interactive. Des commandes spécifiques peuvent être émises pour exécuter tout le code actuellement chargé, ou seulement le code sélectionné : ceci est particulièrement utile lors de l'écriture des fonctions à prototyper ensuite dans une session interactive.
Visualiser les objets R
An R session typically involves many data (and function) objects. Literally thousands more may be loaded from "libraries" (add-on packages). RKward offers an interface to browse and inspect the objects loaded in the R workspace.
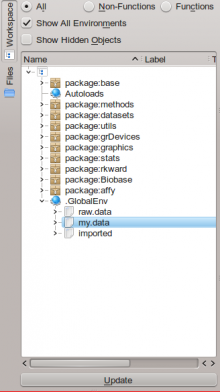
The object browser allows access to both R's global environment (where, typically, user data is kept) and the environments of add-on packages. Additional information are available either as tooltips or by double-clicking items, which will open a new tab in RKWard's interface showing information on the object in question.
Data manipulation
Along with code aids, RKward provides support for handling data, conveniently. In particular, one can view and edit matrices and data frames (R's own definition of data tables) in the interface, or create new ones.
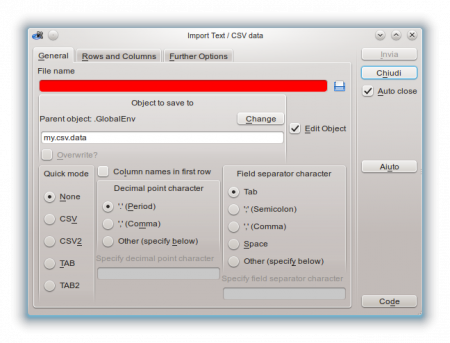
Existing data can be imported: R supports loading text files (TSV/CSV) and also data from widely used statistics programs such as STATA or SPSS. RKWard provides easy to use dialogs for this data import functionality.
The interface can show the column names, the types of the columns (numbers, strings, etc.) and the data itself, using a spreadsheet-like user interface.
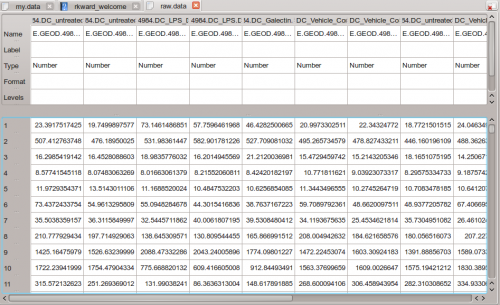
There is direct support for editing and data manipulaiton: for example, adding rows or columns, changing row headers, and also the data type of the columns themselves, acting like a simplified spreadsheet.
Interactive statistics and plotting
RKWard offers simplified front-ends to a number of R's statistical functions and to generate graphs for data. These can be accessed from the , and menus.
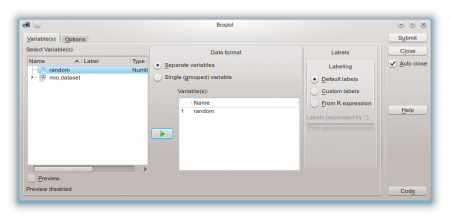
For example, many type of plots can be executed through the functions in the aforementioned menus. Each function (as the example above shows) has its dedicated configuration dialog, where any compatible object from R's global namespace can be used. Also the dialogs offer shortcuts to specific plot or analysis options. Results are then output in HTML form in RKWard's main window, where they can be exported or saved.
Combining statistical analysis and programming
For each action carried out using graphical dialogs, RKWard shows the corresponding R code, transparently. This allows users to copy and paste code to their own scripts, easily, to automate complex tasks. "Run again" links in RKWard's output window allow to repeat an analysis (with or without modified settings), in just a few clicks.
More information
The RKWard homepage has more information, in particular on extending RKWard with custom plugins, and also more screenshots.
