KChart
Appearance
 |
Prepare charts to embed in your documents and slideshows |
History
KChart was the charting tool from KOffice and is still the charting tool from Calligra. In older version, KChart was a standalone application, now it's a part with KGantt of the KDiagram library used by other KDE applications (e.g. Calligra and KMyMoney)[1].
Features
Features include:
- Ease of use
- Default values for all parameters are relative to window size
- All parameters may be edited after drawing the chart
- Choice of legend placement
- Header and footer have font settings defined separately from other fonts

- Multiple Chart types
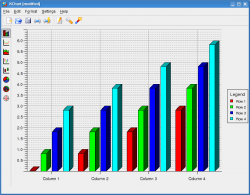
- Bar: normal | stacked | percent, 2D | 3D-Look
- Line: normal | stacked | percent, line markers
- Area: normal | stacked | percent
- HiLo: normal | open-close
- Box & Whiskers
- Pie: normal | exploded, 2D | 3D
- Ring
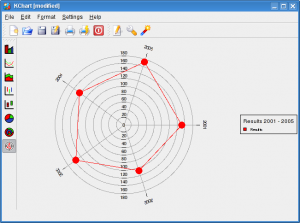
- Polar: normal | stacked | percent
