KmPlot
Hjem » Programmer » Uddannelse » KmPlot

|
KmPlot is a mathematical function plotter. It is part of the KDE Education Project. |
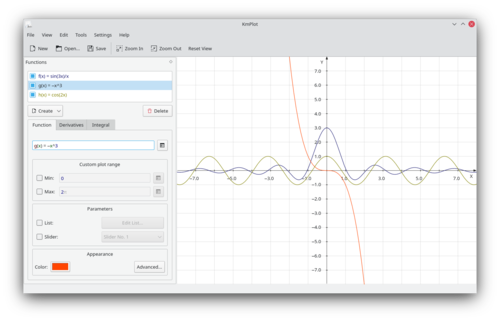
KmPlot has built in a powerful parser. High precision printouts with correct metric scale are very useful as worksheets in math and science lessons.
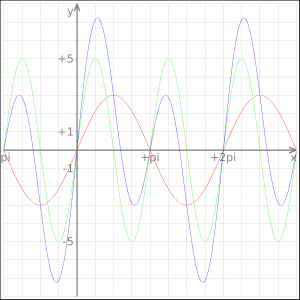
It can plot different functions simultaneously and combine their function terms to build new functions. It supports functions with parameters. You can change the parameters by moving a slider and see how the plot will change.
Features
- powerful mathematical parser
- precise metric printing
- different plot types:
- Cartesian
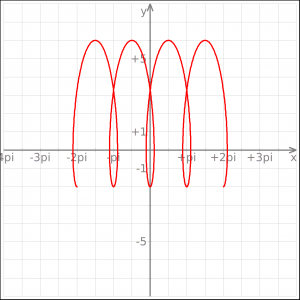
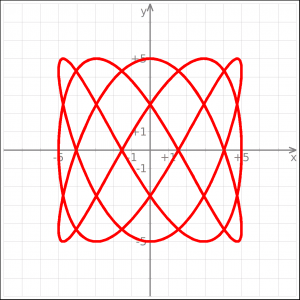
- parametric
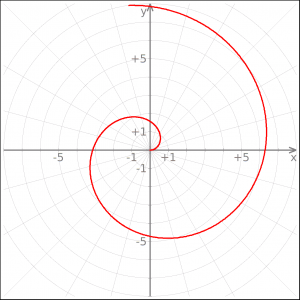
- polar
- implicit
- differential
- highly configurable visual settings (plot line, axes, grid)
- export to bitmap format (BMP and PNG) and scalable vector graphics (SVG)
- save/load complete session in readable xml format
- trace mode: cross hair following plot, coordinates shown in the status bar
- support zooming
- ability to draw the 1st and 2nd derivative and the integral of a plot function
- support user defined constants and parameter values
- various tools for plot functions:
- find minimum/maximum point
- get y-value and draw the area between the function and the y-axis
Example Plots
|
|
|
|
