RKWard
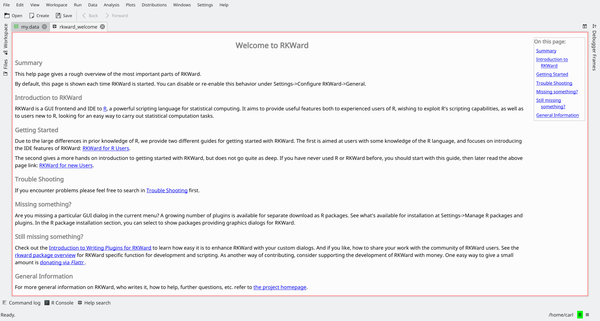
Overview
RKWard is an integrated development environment (IDE) built on top of the KDE Development Platform for the R programming language, a scripting language heavily oriented for statistics and data manipulation,
Features
- Development environment with syntax highlighting, code completion, object browser, help browser
- Transparent interface to R
- Graphical tools to access R's statistical and graphing functions
- Integrated data editor
- Integrated interactive R Console
- R package management
- Loading/Saving R's workspace states
- Extensible through ECMAscript plugins
Use of RKWard as an IDE for R
R is an interpreted language, and RKWard allows to use the R language interactively, just like on a "regular" R console, but with added features like syntax highlighting and support for pasting data from spreadsheet applications. Further, RKWard provides typical IDE features: An integrated script editor, file browser, object viewer, etc.
Interactive interpreter
RKward offers an integrated R prompt which can be used to work with the R engine, interactively.

The prompt is by all intents and purposes identical to the R console prompt, with some additional capabilities. For example, along with function name completion, it supports calltips (pop-up boxes which show a function's signature) and also various way of copying and pasting the code.
This way operates like a normal R session: commands are inputted, output and other objects are created, and results can be shown or saved to disk using R's own functions.
Programming in RKward
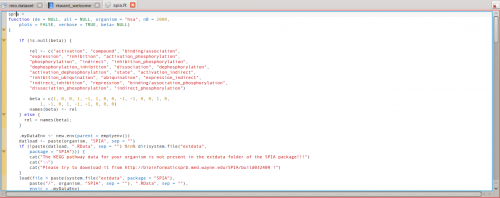
Programming in RKWard is done like in any other IDE: the code editor offers completion, syntax highlighting, and calltips. The code editor however offers additional functions that can be used in an interactive session. Specific commands can be issued to execute all the currently loaded code, or only the selected code: this is particularly useful when writing functions to be then prototyped in an interactive session.
Taking a look at R objects
An R session typically involves many data (and function) objects. Literally thousands more may be loaded from "libraries" (add-on packages). RKward offers an interface to browse and inspect the objects loaded in the R workspace.
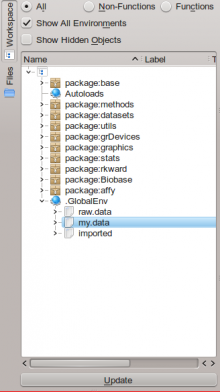
The object browser allows access to both R's global environment (where, typically, user data is kept) and the environments of add-on packages. Additional information are available either as tooltips or by double-clicking items, which will open a new tab in RKWard's interface showing information on the object in question.
Data manipulation
Along with code aids, RKward provides support for handling data, conveniently. In particular, one can view and edit matrices and data frames (R's own definition of data tables) in the interface, or create new ones.
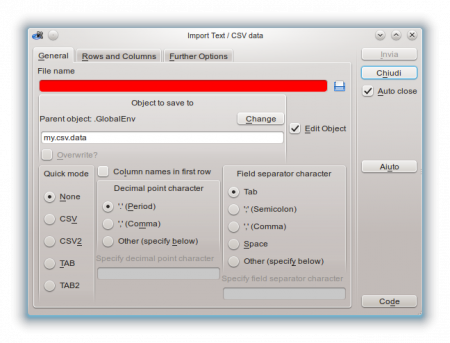
Existing data can be imported: R supports loading text files (TSV/CSV) and also data from widely used statistics programs such as STATA or SPSS. RKWard provides easy to use dialogs for this data import functionality.
The interface can show the column names, the types of the columns (numbers, strings, etc.) and the data itself, using a spreadsheet-like user interface.
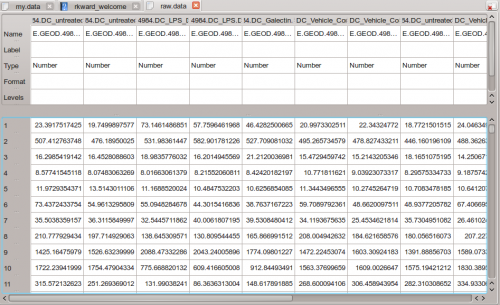
There is direct support for editing and data manipulaiton: for example, adding rows or columns, changing row headers, and also the data type of the columns themselves, acting like a simplified spreadsheet.
Interactive statistics and plotting
RKWard offers simplified front-ends to a number of R's statistical functions and to generate graphs for data. These can be accessed from the , and menus.
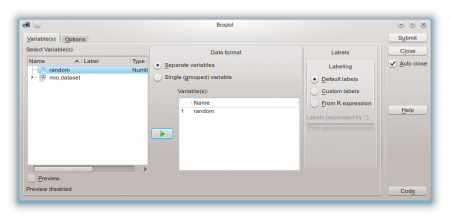
For example, many type of plots can be executed through the functions in the aforementioned menus. Each function (as the example above shows) has its dedicated configuration dialog, where any compatible object from R's global namespace can be used. Also the dialogs offer shortcuts to specific plot or analysis options. Results are then output in HTML form in RKWard's main window, where they can be exported or saved.
Combining statistical analysis and programming
For each action carried out using graphical dialogs, RKWard shows the corresponding R code, transparently. This allows users to copy and paste code to their own scripts, easily, to automate complex tasks. "Run again" links in RKWard's output window allow to repeat an analysis (with or without modified settings), in just a few clicks.
More information
The RKWard homepage has more information, in particular on extending RKWard with custom plugins, and also more screenshots.
