系统活动
介绍
系统活动近似于Microsoft Window的任务管理器,Apple Mac OS X的活动监视器以及GNOME的系统监视器。按住键盘快捷键Ctrl + Esc 或点击KRunner (Alt + F2) 窗口左侧的![]() 「系统活动」图标就会弹出它。
「系统活动」图标就会弹出它。
它显示当前运行进程的列表,外带它们的CPU占用,内存占用和多种其他部分的信息。
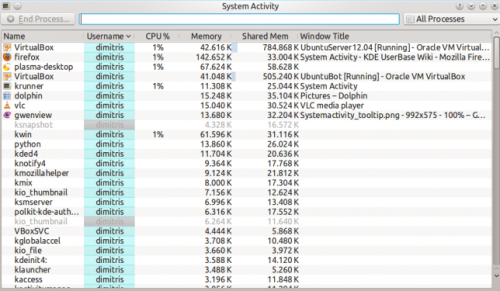
常规提示
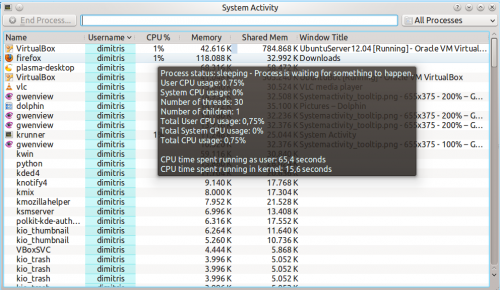
几乎界面每个部分都有工具提示(当你悬停鼠标指针足够久时)来提供更多详细信息,“这是什么功能”(点击![]() 按钮激活)解释信息代表的意思。
按钮激活)解释信息代表的意思。
例如,悬停指针到一个进程的CPU使用率上,我们会看到各种其他信息,包括这个程序总共运行了多长时间。
为什么我当前系统运行的这么慢?
一个系统会由于某个进程(程序)请求所有电脑处理能力(CPU使用)或占用所有电脑的内存而变得异常缓慢。
默认情况下,当前用户拥有的进程中占用大量CPU或内存的进程会靠近顶部。这意味着异常程序应该是靠近顶部,很容易分辨。举个例子:
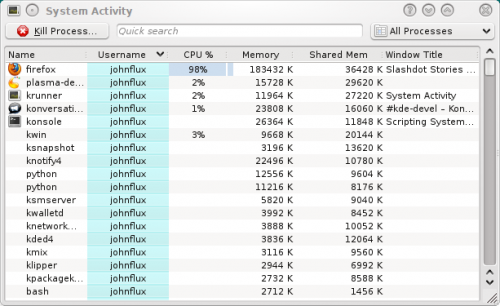
在这个例子中,firefox停止响应并占用了99%的CPU。要终止这个异常的进程,点击进程选定它并按下“杀死进程”按钮。它会发送一个请求(a polite request)给程序,要求它关闭。
我杀不了它 - 它不死!
谢天谢地这种事情很少见,仅仅偶尔你会遇到。如果某个进程异常的话它有可能会忽视你的终止请求,这时我们需要直接强制这个进程终止。这样做可能会导致这个程序打开的文档等未保存就关闭。要强制终止,这样做,右击进程并选择“发送信号”,然后选择“杀掉(杀掉)”。
有时甚至这样也无法杀掉进程,亦或是根本没这个操作选项。这种情况在比如使用某些内核时发生。如果进程本身或是进程的某个线程引发内核 bug,最终使得其陷入不停的执行内核操作中,便处于完全无法杀掉的状态。通常除了重启机子,没其他解决方法了。
僵尸进程
Processes which are in a Zombie state are already dead, and so cannot be killed. The system keeps them around until their parent process notices, which is usually a very short amount of time. Seeing a Zombie process usually indicates that the parent process has stopped responding.
Targeting a window to kill
If you want to kill a particular window that has frozen up, simply press Ctrl + Alt + Esc at any time. The mouse cursor should turn into an image of a skull and cross bones. Now click the window that you want to kill. Note that this will kill the application immediately, and you may lose any unsaved data.
The Memory column shows approximately the amount of memory (RAM) that the process is using by itself, privately. The Shared Memory column is approximately the memory that is, or could be, shared with other programs. For example, the KDE libraries are used by all KDE programs and so are loaded into memory only once.
From KDE SC 4.4, you can right-click on a process and view the for the process to get more accurate readings.
Technical Information
The "Memory" column shows the value of VmRSS - Shared, and so is generally lower than the values shown by top etc. This does not include memory backed I/O pages, and does not include memory used by the x server to store any pixmaps used by the application. This value is often called the Unique RSS size, or URSS. This approximates the value shown as Private memory usage in the .
The Shared memory is the same as the SHR column in top and can be somewhat inaccurate. This approximates the value shown as Shared memory usage in the .
Specifically the process list parses /proc/pid/stat whereas the dialog parses /proc/pid/smaps.
How do I view more Detailed Memory Information about a process?
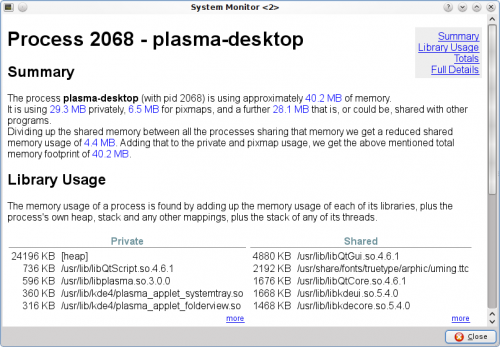
From KDE SC 4.4 you will be able to select a process in the table, right click on the process, and choose , and get something like:
Why do values in Detailed Memory Information not match the process list?
The process list in System Activity is using an approximation to gather the values. The gives more accurate values.
Why is the "Xorg" process using so much memory?
This is the process that displays all the other applications. Its memory usage includes all the memory used on the video card to store all the pixmaps (images) from applications.
In general you do not need to worry about the memory usage of Xorg.
How do I see the PID of a process?
If you want to see the PID of a single process, hover the mouse cursor over the name of the process. The PID will be shown in the tooltip.
If you want to see the PID of all the processes, right click on any column heading and you will see the menu:
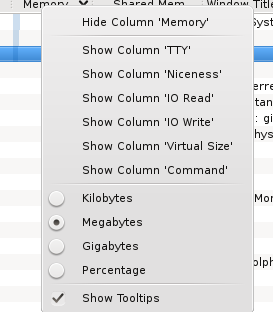
Choose .
Can System Activity show the I/O Hard Disk usage, like iotop?
Right click on the column headings, and choose and again for . It will now show the amount of data being sent to or from the hard disk.
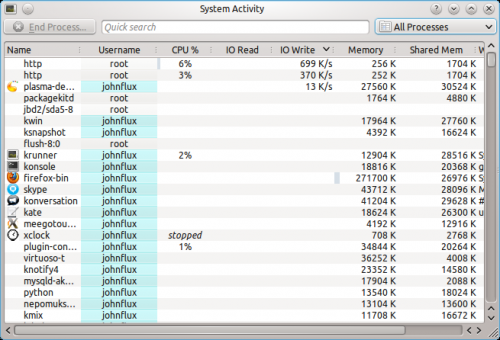
By right clicking on the column header you can chose whether you want to view the actual amount of data being written or read from the hard disk (the default), or whether you are interested in seeing how much data the application is sending or requesting from a file.
Data requested and actual data read from the hard disk are not equivalent - for example, if two applications read from the same file the operating system does not need to read from the actual hard disk twice - it can just read it once and remember it for a short while. Similarly, if one process writes to a file, but then another process writes over the top of that same file, there's no point writing the first version of the file to the actual hard disk.
Why are some processes grayed out?
For example the process xclock:

This means that the process has already died. It is shown as a disabled
process just for convenience to make it easier to see processes that are quit.
The values for the CPU usage, Memory usage, etc are just the values from when the process was last seen alive. A process that has ended does not take up any resources (it uses no CPU, memory etc).
What are all of these processes owned by root and taking up no memory?
These are kernel threads. They exist only inside the kernel, and exist to allow the kernel to perform multiple tasks in parallel.
They are shown because occasionally they can be a cause of heavy CPU usage. For example, under a heavy load, and with bad drivers, a network card can produce a huge number of interrupts, resulting in a high CPU usage in the ksoftirqd kernel thread.
Likewise, a high CPU usage in kjournald can indicate that DMA transfer is not enabled on the hard disk.
Why do I have so many processes?
A normal average-user system has around 150 to 200 processes with strange sounding names. It would be nice to setup a wiki page giving a short description of each of these processes, but so far nobody has done this. ![]()
Why is OpenOffice.org not showing up as a graphical program?
Before version 3.3, OpenOffice.org did not correctly implement the window standards. Specifically, their windows did not set _NET_WM_PID to link the windows to the process. This is now fixed in OpenOffice.org 3.3.
Why is gvim showing up strangely as a graphical program?
This is a fault with the GVim program. GVim does not correctly implement the window standards. Specifically, when it starts up it forks a new process to avoid hanging the shell that it ran from. But it sets the _NET_WIN_PID property to the previous PID. The authors have been notified but have not fixed this yet.
